Desk Presence Sensor for Hot Desking: A 2026 Guide
How a desk presence sensor for hot desking works with mmWave radar, covering accuracy, mounting, privacy, integrations and pilot design for workplace teams.

Hot desking only works when the map matches reality. A booking system can show a seat as reserved while the person sits somewhere else, and a floor plan can claim ninety percent utilisation while half the desks are empty by ten in the morning. The gap between what the booking system believes and what the floor actually contains is the reason workplace teams start looking for a desk presence sensor for hot desking, and it is also the reason so many first attempts disappoint: a room-level sensor mounted on a ceiling cannot tell a facilities team which of twelve desks are occupied.
The problem is one of granularity, and it changes almost every other decision that follows. A sensor that reports room occupancy every ten minutes is adequate for HVAC scheduling and useless for seat-level analytics. A sensor that reports desk-level state needs a different mounting plan, a different accuracy test, a different privacy conversation and a different integration path into the booking platform. This guide works through those decisions in the order a real project encounters them, from what the hardware can physically measure to how to prove in a pilot that the numbers are trustworthy enough to change how a floor is managed.
What a Desk Presence Sensor for Hot Desking Measures
A desk presence sensor for hot desking measures occupancy at the level of an individual seat rather than a whole room, reporting whether a specific desk is in use, how long that state has persisted and, in some configurations, how many people occupy a small zone. The measurement is typically made with passive infrared, time-of-flight or millimeter-wave radar, and the technology choice decides whether the device detects a person who sits still, reads, or hides behind a monitor. Detection range, field of view and mounting height determine how many desks one device can cover, while the reporting interval determines whether the data can support real-time seat release or only retrospective analytics. Because the unit of analysis is a seat, the sensor must resolve adjacent desks and ignore passers-by, and the installation plan needs an explicit mapping between each sensor footprint and the desk identifiers used by the booking system.
Desk-level sensing differs from room-level sensing in three ways that matter operationally. First, the unit of analysis is a seat, so the sensor must resolve adjacent desks rather than treating a zone as occupied or empty. Second, the data must distinguish a person at a desk from a person walking past it, which requires either a short presence confirmation window or a narrow detection zone. Third, the output must reconcile with a booking system that identifies desks by name, which means the installation plan needs a mapping between physical sensor coverage and desk identifiers before the first device is mounted.
The Three States a Workplace Team Actually Needs
Most workplace teams discover that they need three states rather than two. The obvious states are occupied and vacant. The third is ambiguous: a desk with a bag on it, a laptop left open, or a chair pushed back may be technically occupied but practically available, and different teams want different behaviour for that case. Some treat any presence as occupied, which is safer for cleaning schedules and worse for seat sharing. Others add a short grace period, so a desk only becomes vacant after several minutes without presence, which reduces false releases when someone steps away.
The sensor specification should therefore be evaluated on state transitions, not only on detection. Ask how quickly the device reports a person arriving, how long it waits before reporting departure, and whether those timings are configurable per zone. A fixed sixty-second departure delay is fine for utilisation analytics and unhelpful for an app that wants to release a seat the moment someone leaves.
What the Sensor Cannot Tell You
A desk presence sensor reports presence, not identity. It cannot say who is sitting at the desk, whether the person is the person who booked it, or whether they are working or reading. That limitation is usually framed as a privacy feature, and it is also a design constraint: any system that claims to attribute seats to individuals must combine sensor data with another signal, such as a badge event or a booking confirmation, and should be explicit about the combination.
The same limitation applies to intent. A person standing at a desk for two minutes may be chatting, packing up, or trying to find a colleague. Analytics that treat every presence as a work session will overstate utilisation. A useful data model records presence intervals, then lets the analytics layer decide what counts as a session, rather than embedding that judgement in the sensor firmware.
Why Hot Desking Needs Desk-Level Sensing
Hot desking needs desk-level sensing because the decisions it supports are seat-level decisions about which seats are used, when, and by how many people relative to a booking. Room-level sensors answer a different question: they report that a space was occupied without showing whether the occupant sat at a desk or stood by a window, and a zone sensor covering forty desks cannot reveal that eight desks carried most of the traffic. Workplace strategies that reduce seats per employee rest on a utilisation figure, and every point of error in that figure changes the real estate saving. Badge counts overstate presence because people enter a building and work elsewhere, while booking data overstates demand because reservations are made speculatively and abandoned without cancellation. Desk-level presence measures what happened rather than what was planned or announced.
Utilisation is usually expressed as a ratio between peak simultaneous occupancy and the number of seats provided. The ratio hides two different questions: how many seats were used at the busiest moment, and how many were used on an average day. Desk-level data separates them, because it records every seat's state through the day rather than a single peak number. A floor that peaks at ninety percent on Tuesday and averages forty percent across the week supports a different decision from a floor that sits at sixty percent every day, even though both produce the same monthly utilisation figure.
Room-Level, Zone-Level and Desk-Level Compared
The three levels of granularity serve different purposes, and most buildings end up with a mix. Room-level sensors suit meeting rooms, phone booths and wellness rooms where the whole room is the unit of use. Zone-level sensors suit open-plan areas where the question is how busy a neighbourhood is, and where per-desk resolution would be expensive relative to the value. Desk-level sensors suit hot-desking floors where seat assignment, release and utilisation reporting are the point.
| Granularity | Typical device coverage | Data produced | Fits these decisions | Does not fit |
|---|---|---|---|---|
| Room level | One room per sensor | Occupied or vacant per room | Meeting room release, HVAC, cleaning | Seat utilisation, desk release |
| Zone level | 10 to 40 desks per sensor | Count and density per zone | Space planning, lighting zones | Which specific desk is free |
| Desk level | 1 to 6 desks per sensor | State per seat, dwell time | Hot-desking release, seat analytics | Identity, meeting room attribution |
The practical consequence is that a desk-level deployment costs more per square metre than a zone deployment, because it needs more devices, more careful mounting and a reconciliation step that maps sensors to seats. Teams that skip the mapping step end up with good data that nobody can act on, which is the most common failure mode in workplace sensing projects.
What Desk-Level Data Changes in Daily Operations
The first operational change is seat release. When a desk is booked but not occupied within a configured window, the system can release it to someone else, which raises the effective capacity of a floor without adding furniture. The second is cleaning and maintenance routing, where knowing which desks were used changes how often they are wiped. The third is exception handling: a desk that shows continuous occupancy for twelve hours is usually a sensor problem or a forgotten laptop, and flagging it saves a facilities visit.
None of these require identifying people. They require reliable presence intervals attached to seat identifiers, and a policy for what happens when the sensor and the booking disagree. Writing that policy down before deployment prevents the familiar situation where facilities trusts the sensor, the workplace team trusts the booking system, and the two teams spend meetings arguing about whose numbers are right.
Desk Presence Sensor for Hot Desking Versus PIR Occupancy
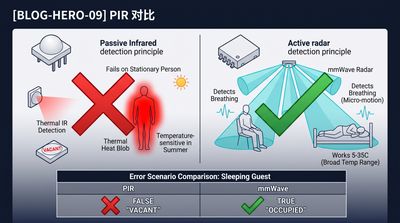
A desk presence sensor for hot desking cannot rely on passive infrared alone because PIR responds to changes in infrared energy, which makes it strong at detecting movement and weak at detecting stillness. At a desk, stillness is the normal state: reading, typing without moving the torso, or sitting in a call with a headset produces almost no thermal movement, so a PIR detector reports vacant while someone is present and flips back when they reach for coffee. Millimeter-wave radar transmits a continuous or frequency-modulated signal and analyses reflected energy, which lets it detect micro-motion such as breathing and small hand movement at ranges of one to four metres. The trade-off is cost, power and configuration complexity, which is why radar belongs where the accuracy requirement justifies it and why PIR remains common in corridors, gyms and spaces where gross movement is the signal that matters.
The difference shows up in the occupancy record rather than in the datasheet. A PIR-based desk sensor produces short occupied intervals followed by long vacant gaps whenever the occupant sits still, which inflates the number of sessions and deflates average dwell time. Radar produces longer continuous intervals that match what an observer would record. When both are compared against a walking audit, the radar record aligns with reality and the PIR record shows a characteristic sawtooth, which is why pilots that compare vendors usually converge on radar for seat-level work.
Why Desk-Level Stillness Breaks PIR
PIR sensitivity is usually described in terms of detection range and angle, but the relevant metric for desk sensing is dwell time in a still posture. A PIR detector with a sixty-second hold time will keep reporting occupied for a minute after movement stops, then drop to vacant. If the person continues to sit still, the occupancy state becomes wrong and stays wrong until the next movement. Multi-segment PIR sensors and dual-technology detectors improve the situation but do not solve it, because the fundamental signal is absent.
The practical consequence is that PIR-based desk sensing produces systematic undercounting during focused work and overcounting during transitions. For a gym or a corridor that is acceptable. For a hot-desking floor where the whole point is to know which seats are free, it undermines the business case.
Radar Parameters That Decide Desk Accuracy
Radar accuracy at desk level depends on more than the frequency band. Detection range sets the maximum mounting height and the maximum horizontal distance. Field of view, expressed as azimuth and elevation angles, decides how many desks a single device can distinguish and where the coverage edges fall. Range resolution decides whether two people at adjacent desks appear as one target. Micro-motion sensitivity decides whether a breathing person is detected, and the presence confirmation and departure timers decide how quickly states change.
A specification that lists only frequency and range is not enough to plan a desk deployment. Ask for the beam pattern, the minimum detectable micro-motion, the false-positive behaviour with fans and monitors, and the recommended mounting height for desk-level use. Ask also how the device behaves when a monitor, a plant or a partition sits inside the detection zone, because those objects are normal in an office and abnormal in a corridor.
| Sensing technology | Detects still person | Typical desk-level fit | Main weakness | Power profile |
|---|---|---|---|---|
| PIR | No | Poor for seat release | False vacant during focused work | Very low |
| Time-of-flight | Partly | Limited by line of sight | Sensitive to desk clutter | Low to medium |
| 24 GHz radar | Yes, with tuning | Good for small zones | Coarser range resolution | Low |
| 60 GHz radar | Yes | Best for per-desk resolution | Higher cost, careful mounting | Low to medium |
How Many Desks One Sensor Covers in a Hot-Desking Layout
How many desks one sensor covers depends on mounting height, beam geometry, desk layout and the accuracy the project requires. A ceiling-mounted 60 GHz radar with a narrow beam typically serves one to four desks in a bench layout when the goal is per-seat state, while a wider-beam device mounted higher can cover six to eight desks at the cost of blurring boundaries between neighbours. A 24 GHz device with a broader pattern is often used to cover a cluster and report counts rather than individual seats. Geometry matters more than the datasheet range: radar coverage forms a cone whose useful footprint is its intersection with the desk plane at roughly 0.7 to 1.2 metres above the floor. Mounting higher widens the footprint but weakens the return from a seated torso, and mounting lower narrows it while increasing the risk that monitors and partitions shadow the target.
Mounting height also determines what the sensor cannot see. A device at 2.4 metres sees a circle roughly two metres across with a narrow beam, which fits a bench pair but not a four-desk cluster. A device at 3.4 metres widens that circle but collects weaker reflections from a seated person wearing dark clothing. The practical method is to test one device at the intended height in the real room before committing to a layout, then adjust the height rather than the sensitivity, because sensitivity changes affect false positives across the whole floor.
Drawing the Coverage Before Ordering
The most reliable way to size a deployment is to draw the floor plan with desks, partitions, monitors and lighting positions, then overlay the coverage cones at the chosen mounting height. This exercise surfaces problems that a specification sheet hides: a column in the middle of a bank, a glass partition that reflects radar energy, a desk cluster under an air handling unit that vibrates, or a row of desks that sits directly beneath a skylight where mounting is awkward.
The drawing also answers the reconciliation question. Each sensor footprint should map to a named group of desks, and each desk should appear in exactly one footprint where per-seat data is required. Desks that fall on a boundary get assigned deliberately rather than by accident, and the installation team gets a document it can follow instead of improvising at the ceiling.
Coverage Trade-Offs by Layout
Bench layouts with back-to-back desks are the easiest case, because each side of the bench is a distinct zone and a single device above the divider can sometimes serve two seats. Linear layouts along a wall are harder, because the beam spreads along the desk run rather than across it. Cluster layouts with four desks facing a central pillar suit a single wide-beam sensor reporting a count rather than individual states.
| Layout | Typical desks per sensor | Mounting note | Data quality |
|---|---|---|---|
| Back-to-back bench, 2 to 4 seats | 2 to 4 | Centred on the divider | Good per-seat resolution |
| Linear wall run, 4 to 8 seats | 3 to 4 with narrow beam | Offset from the wall, angled down the run | Boundary effects at the ends |
| Four-desk cluster | 4 as a zone | Centre of the cluster | Count only, not per seat |
| Private offices | 1 per office | Centre of the room | Room-level equivalent |
| Height-adjustable desks | 2 to 4 | Account for standing height | Reduced signal when standing |
Height-adjustable desks deserve special attention. A person standing at a raised desk is closer to the sensor and moves more, which usually improves detection but can also spill energy into the neighbouring footprint. Test the standing configuration during the pilot rather than assuming the seated case represents the floor.
Desk-Level Data and Booking System Integration
The data model is where desk-level sensing either becomes useful or becomes another unused dashboard. A workable model records, for each desk, a history of presence intervals with start and end timestamps, the sensor that produced them, a confidence flag and the mapping version in force at the time. The booking platform consumes those intervals to reconcile reservations, the analytics layer aggregates them into utilisation and dwell figures, and facilities uses exceptions to find broken sensors or abandoned desks. What the model should not do is collapse everything into a single daily percentage, because aggregation destroys the information needed to audit accuracy or replay a disputed state. Keep raw intervals at the centre of the design, derive summaries later, and make sure the mapping between physical coverage and desk identifiers is versioned so that furniture moves do not silently rewrite history.
Integration paths vary by platform maturity. The simplest is a scheduled pull: the booking system queries desk state every minute and updates its availability. The next step is event-driven delivery through webhooks or a message broker, which reduces latency and makes seat release feel immediate in the app. The most demanding case is bidirectional control, where the booking platform can place a desk into a hold state and the sensor confirms arrival, which requires an idempotent API and a clear rule for what happens when the two disagree.
Mapping Sensors to Desks Without Ambiguity
Every sensor needs a stable identifier that survives furniture moves, and every desk needs an identifier that the booking system already uses. The mapping between them belongs in a configuration table with an effective date, not in an installer's spreadsheet. When a bank is reconfigured, the mapping changes and the historical data stays attached to the correct physical location rather than to whatever desk number the furniture happened to carry.
Sites that skip this step discover the problem six months later, when utilisation reports show a desk that was never occupied and a sensor that reports six seats in a four-seat bank. The fix then requires walking the floor with a laptop, which is exactly the kind of work the project was meant to eliminate.
Reporting Intervals and State Transitions
Reporting interval is a design decision with visible consequences. A thirty-second interval is fine for utilisation analytics and too slow for a seat-release app that wants to free a desk within two minutes of a no-show. Event-based reporting, where the sensor pushes a message only when state changes, is more efficient and more precise, but it requires the platform to handle bursts and to reconcile missed events after a gateway outage.
Whatever the interval, the platform should record the raw transitions and derive the aggregates later. Aggregating at the edge destroys the information needed to audit accuracy, and audits are how a workplace team defends its numbers when a real estate decision is challenged.
Analytics That Fit the Data
Desk-level presence supports several analytics that room-level data cannot: peak seat demand by hour and by neighbourhood, the ratio of booked to occupied seats, average dwell time per desk type, the share of desks used less than two hours a day, and the effect of a policy change on seat choice. Each of these answers a specific planning question. None of them requires knowing who sat where, which keeps the privacy surface small and the governance conversation short.
Teams often ask for a utilisation heatmap first. That is a reasonable start, but the more valuable output is usually the booked-versus-occupied gap, because it directly quantifies how much capacity the organisation is losing to no-show bookings.
Privacy and Employee Trust in Desk-Level Sensing Projects
Privacy decides whether a desk-level sensing deployment survives contact with the workforce, because radar sensing at a seat can feel like monitoring even when it cannot identify anyone. The defensible position is that the sensor reports that a seat is occupied, not who occupies it, and that individual attribution is impossible without a separate data source the organisation has deliberately chosen to add. That position has to be true in practice: the data model stores seat identifiers and presence intervals, not employee identifiers and movement traces, retention is short enough for operations and long enough for planning, and aggregation happens before data reaches systems that hold personal information. Document the purpose, fields, retention, access roles and aggregation rules before installation, state that the device captures no images and no audio, name the person who answers employee concerns, and exclude wellness, prayer and nursing rooms from coverage entirely.
That position has to be true in practice, not only in the slide. The data model should store seat identifiers and presence intervals, not employee identifiers and movement traces. Retention should be short enough to serve operations and long enough to answer planning questions, and the aggregation should happen before data reaches any system that holds personal information. If the organisation later wants to link presence to bookings for reconciliation, that link should be an explicit, documented step with its own lawful basis.
What to Document Before the First Sensor
Document the purpose, the data fields, the retention period, the access roles and the aggregation rules before installation. State clearly that the sensor does not capture images, does not record audio, and does not distinguish individuals. Describe how employees can raise concerns and who answers them. In European jurisdictions this material feeds the data protection impact assessment; elsewhere it is simply good governance, and it shortens every conversation that follows.
The physical installation also communicates. A visible sensor with a small label explaining what it measures and what it does not measure defuses more anxiety than a memo. Sensors hidden in ceiling tiles generate suspicion out of proportion to their capability.
Handling Sensitive Zones
Some areas should not be sensed at desk level at all. Wellness rooms, prayer rooms, nursing rooms and anywhere employees expect privacy should be excluded from the deployment, even if they contain desks. The exclusion should be visible on the floor plan and in the data model, so that a later change of scope cannot quietly add them back.
The same logic applies to individual performance. Desk-level data should not be used to evaluate individuals, and the governance document should say so explicitly. Where an organisation cannot commit to that, the project should stop rather than proceed with a sensor network that will eventually be repurposed.
Power, Network and Mounting Options for Desk Sensors
Power and network choices shape both the cost and the maintenance burden of a desk-level sensing fleet. Battery-powered sensors install with the least disruption because no cable runs to the ceiling, but they depend on a radio link and a replacement cycle. Mains-powered sensors with Power over Ethernet are the most reliable and the most expensive to retrofit, while Zigbee or sub-GHz mesh devices sit in between, trading determinism for flexibility. The building usually decides: new construction plans ceiling power and structured cabling, occupied retrofits often have neither, and mixed estates use both. Battery life is dominated by radio transmission and wake pattern rather than by sensing, so ask for the calculation at the intended reporting profile with its assumptions, and plan replacement as scheduled maintenance. Gateway placement controls coverage and failure scope, so plan one per floor zone with overlap at boundaries and test packet success with ceilings finished.
The decision usually follows the building. New construction can plan ceiling power and structured cabling, so PoE is the natural choice. Retrofits in occupied offices often have neither spare cable nor power at the ceiling, which pushes the design toward battery sensors with a gateway per zone. Mixed estates frequently use both, with PoE in the headquarters building and battery devices in satellite offices.
Battery Life and Reporting Frequency
Battery life in a desk sensor is dominated by radio transmission and by the wake pattern. A sensor that reports only on state change consumes far less than one that reports every thirty seconds regardless of activity. The practical number to ask for is battery life at the intended reporting profile, not the best-case figure on the datasheet, and the answer should come with the assumptions: events per day, radio transmit power, ambient temperature and gateway distance.
A workplace floor with eight hours of activity and roughly six transitions per desk per day is a very different load from a lobby with continuous movement. Ask the supplier to calculate life for the actual profile, and plan battery replacement as a scheduled maintenance task rather than a reactive one.
Network Topology and Gateway Placement
Desk sensors rarely connect directly to the internet. They connect to a gateway that aggregates a zone and forwards data to the platform. Gateway placement therefore controls both coverage and failure scope: a gateway that serves forty desks becomes a single point of failure for those forty desks, and a gateway placed inside a metal ceiling void may cover far fewer than expected.
Plan one gateway per floor zone with overlapping coverage at the boundaries, and test packet success with the ceiling in its final state. Office ceilings are full of ducts, cable trays and fire dampers that are invisible on a plan, and a radio survey that ignores them will overstate coverage.
| Power and link option | Install cost | Reliability | Maintenance | Best fit |
|---|---|---|---|---|
| PoE Ethernet | High | Highest | Low | New build, planned ceilings |
| Mains with Wi-Fi | Medium | Medium | Low | Buildings with strong Wi-Fi |
| Battery with Zigbee gateway | Low | High | Battery rounds | Retrofits, dense floors |
| Battery with sub-GHz gateway | Low | High | Battery rounds | Large floors, wall penetration |
Installing and Commissioning a Desk-Level Sensing System
Installation and commissioning determine whether the accuracy promised in a pilot survives production, and a desk-level installation introduces error at four points: mounting position, mounting angle, detection-zone configuration and seat-by-seat validation. Commissioning should proceed seat by seat rather than sensor by sensor, with the installer sitting at each desk, confirming the platform reports occupancy within the expected time, standing up, confirming the return to vacant and recording the result. Mount the device so the beam covers the desk surface rather than the chair or the aisle, because aiming matters more than height: a sensor aimed at the aisle detects passers-by and misses the occupant. Monitors, dividers, acoustic panels and tall plants inside the beam attenuate or reflect radar energy and must be recorded. Calibrate against a known reference, such as an hour-long walking audit, and fix systematic gaps before scaling.
Commissioning should be done seat by seat, not sensor by sensor. The installer sits at a desk, confirms the platform shows that desk as occupied within the expected time, stands up, confirms the transition back to vacant, and records the result. A bank of four desks takes a few minutes per sensor and produces a record that the operations team can use later when a query arises.
Mounting Height, Angle and Obstructions
Mount the device so its beam covers the desk surface rather than the chair or the aisle. Aiming matters more than height: a sensor aimed at the aisle will detect passers-by and miss the person at the desk. Ceiling tiles, light fixtures and sprinkler heads all intrude on the mounting position, and a device that sits flush with the tile plane performs differently from one recessed into a housing.
Obstructions inside the beam are the second source of error. Monitors, desk dividers, acoustic panels and tall plants all attenuate or reflect radar energy. The commissioning record should note what sits inside each footprint, so that a later furniture change can be assessed against a known baseline rather than discovered through bad data.
Configuration and Calibration
Most radar sensors expose configuration for sensitivity, detection zone size, presence confirmation time and departure delay. Set them consistently across a floor, document the values, and resist the temptation to tune one sensor to fix a data problem that is really a mounting problem. A sensor that needs unusual sensitivity to detect a seated person is probably aimed at the wrong place.
Calibration against a known reference is what separates a demonstration from a deployment. Count the transitions observed by a person walking the floor for an hour and compare them with the platform's record. Small discrepancies are normal; systematic gaps indicate a mounting or configuration issue that should be fixed before scaling to the rest of the building.
Accuracy, Precision and Drift in Desk-Level Occupancy Data
Accuracy in desk-level sensing is not a single number, and a desk-level sensor can be strong at detecting presence while weak at detecting absence, or accurate at both while slow to report. The two metrics that matter are sensitivity, the share of genuinely occupied desk-minutes reported as occupied, and specificity, the share of genuinely empty desk-minutes reported as empty; a sensor with very high sensitivity and poor specificity will report an empty floor as half occupied, which misleads planning more than a lower-sensitivity device would. Drift is the third property, because deployments degrade as furniture moves, partitions appear or firmware updates change defaults. Track drift with a recurring spot check of a small desk sample and a dashboard that flags sensors whose occupancy rate diverges from their neighbours. Report both metrics with the observation method attached rather than quoting a single accuracy percentage.
Drift is the third property and the one that projects underestimate. A deployment that tests well in commissioning can degrade over months as furniture moves, partitions are added, or firmware is updated with different defaults. Tracking drift requires a small recurring validation, such as a monthly spot check of twenty desks against a walk-through, and a dashboard that flags sensors whose occupancy rate diverges from their neighbours.
Measuring Sensitivity and Specificity Without a Lab
The practical way to measure both is a walking audit. Choose a sample of desks that represents the floor, have an observer record actual occupancy every minute for an hour during normal work, and compare that record with the platform output. Repeat at different times of day and on a quiet day, because a sensor tuned on a busy Tuesday may behave differently on a empty Friday.
The result should be reported as a pair of numbers with the observation method attached. A vendor that reports a single accuracy percentage without saying which error dominates is telling you nothing useful. Ask for both, and ask how they were measured.
Drift, Firmware and Furniture Changes
Three events reliably change desk-level performance: firmware updates, furniture reconfiguration, and ceiling works. Each should trigger a partial revalidation. The firmware case is the most insidious because the change arrives remotely and silently, and a new default departure delay can shift utilisation figures by several points without anyone touching the hardware.
Version control helps. Record the firmware version per sensor at commissioning and after each update, and compare occupancy statistics before and after. A change of more than a few percent in the same week as a firmware push is a strong signal that behaviour changed.
Designing a Hot-Desking Sensing Pilot
A pilot for desk-level sensing should answer three questions: whether the technology detects the people on this floor accurately enough, whether the integration produces numbers the business trusts, and whether the operational workflow around seat release works. A pilot that only proves sensors report presence has tested the least interesting part of the project. Run it on one floor or neighbourhood with thirty to sixty desks and a mix of layouts, long enough to include a quiet week and a busy week, with a manual audit running throughout so comparison data exists. Agree acceptance criteria in advance: sensitivity and specificity thresholds from a walking audit, state-transition latency, and successful reconciliation of booked versus occupied seats for a defined share of bookings. Add an operational criterion that a facilities user can find and interpret a desk history without training, then publish the measured results internally.
Run the pilot on one floor or one neighbourhood with enough desks to be representative, ideally thirty to sixty. Choose a floor with a mix of layouts, because a bench-only pilot will miss the problems that appear along wall runs and in clusters. Run it long enough to include a quiet week and a busy week, and keep the manual audit running throughout so that the comparison data exists.
Acceptance Criteria Worth Agreeing Up Front
Agree the criteria before installation. Useful ones include sensitivity above a stated threshold during a walking audit, specificity above a stated threshold, state transition latency within a stated number of seconds, and successful reconciliation of booked versus occupied seats for at least a defined share of bookings. Add an operational criterion: a facilities user can find and interpret a desk's history without training.
Write the criteria into the pilot document with the measurement method. A criterion that cannot be measured by both parties becomes a dispute, and disputes in pilots usually end with the project proceeding on optimism.
What to Do With Pilot Results
If the criteria pass, scale with the same mounting plan and configuration values, and keep the audit cadence through the first month of production. If they fail, the reason matters: mounting errors can be fixed, integration mismatches can be repaired, and technology limits should stop the rollout rather than be papered over with analytics.
Publish the results internally. A short summary with the measured numbers, the layout problems found and the fixes applied gives the next floor's team a realistic starting point and gives the project the credibility it needs when the budget conversation returns.
Cost and Return on a Desk-Level Sensing Deployment
The cost of a desk-level sensing project has four components: hardware per sensor, installation and commissioning labour, gateway and network infrastructure, and the integration work that connects data to a booking or analytics platform. Hardware and installation are usually easy to price; integration is routinely underestimated and decides whether the project delivers value or produces an unused dashboard. The return side is driven by real estate rather than by sensor savings. If seat-level data lets the organisation operate with fewer seats without reducing the experience, the avoided annual cost per seat is the benefit; if the data only improves reporting without changing a lease decision, the return is analytical and the business case should say so. Build the model from seat count, all-in annual cost per seat and the current seat-to-person ratio, keep assumptions visible, and test what happens if measured utilisation is ten points lower than the booking system suggested.
The return side is driven by real estate, not by sensor savings. If seat-level data allows an organisation to operate with fewer seats without reducing the experience, the avoided cost per seat per year is the benefit. If the data only improves reporting without changing a lease decision, the return is analytical rather than financial, and the business case should say so. Sponsors who expect a payback from a dashboard alone are usually disappointed.
Building the Business Case With Real Numbers
Start with the number of seats, the annual all-in cost per seat and the current seat-to-person ratio. Then model what changes if utilisation is measured accurately: fewer seats at the same headcount, a smaller floor plate at renewal, or a delay in expansion. Keep the assumptions visible so that a sceptical finance partner can challenge each one.
A useful sensitivity test is to ask what happens if the measured utilisation turns out to be ten points lower than the booking system suggested. If the answer changes the decision, the pilot matters. If not, the sensing project may be a nice-to-have and should be scheduled accordingly.
Where Costs Hide
Hidden costs appear in ceiling access, out-of-hours installation, network changes, and the internal time spent reconciling sensors with desks. Ceiling access in particular can dominate a retrofit: lifting tiles, working around services and reinstating finishes may cost more than the devices. Include a contingency for access work and schedule it with the facilities team rather than around them.
The other hidden cost is ongoing ownership. Battery rounds, firmware management, mapping maintenance and periodic audits all need an owner. A project that funds installation but not ownership will degrade quietly, and the first symptom will be a utilisation report that nobody believes.
Common Mistakes in Desk-Level Sensing Projects
Most desk-level sensing failures are not hardware failures. They are early decisions that turn out to be wrong later: a coverage plan that ignored partitions, a sensor-to-desk mapping that lived in a spreadsheet, a pilot run on an unrepresentative floor, or an integration that produced numbers the business could not reconcile with anything else. The pattern behind them is a preference for speed over design, because teams that skip the coverage drawing, the commissioning record and the acceptance criteria save a week at the start and lose a quarter at the end. Mounting mistakes are the most common: aiming at aisles, mounting too high to resolve adjacent desks, or letting monitors sit inside the detection zone all produce plausible data that is systematically wrong. Inconsistent mounting height across a floor compounds the problem, because two sensors configured identically but mounted differently will report differently.
The pattern behind them is a preference for speed over design. Teams that skip the coverage drawing, the commissioning record and the acceptance criteria usually save a week at the start and lose a quarter at the end.
Coverage and Mounting Mistakes
Aiming sensors at aisles, mounting them too high for the beam to resolve adjacent desks, or placing them so that monitors fall inside the detection zone all produce plausible-looking data that is systematically wrong. The fix is the coverage drawing and the seat-by-seat commissioning described earlier, done before the fleet is ordered rather than after the first complaints.
A second mounting mistake is inconsistent height across a floor. Two sensors at different heights with the same configuration will have different footprints and different accuracy, which makes floor-level comparisons unreliable. Standardise the mounting height and record it.
Data and Integration Mistakes
The classic data mistake is storing presence only as a daily aggregate. Without transitions, no audit is possible, no state can be replayed, and no booking reconciliation can be validated. Store raw intervals and derive aggregates later.
The classic integration mistake is failing to define what happens when the booking and the sensor disagree. Someone must own that rule: does the sensor override the booking, does the booking win until a human intervenes, or does the desk enter a review state? Leaving it undefined guarantees that two teams will interpret the data differently and that the project will be blamed for the confusion.
A Procurement Checklist for Desk-Level Sensing Hardware
A procurement checklist for desk-level sensing hardware keeps the specification honest by covering five areas: the sensing requirement, the mounting conditions, the power and network constraints, the integration interface and the governance evidence. The goal is not a long document but a short list of answers that each party can verify, agreed before purchase and revisited at commissioning. It also protects the supplier relationship, because a supplier given clear requirements can quote accurately and flag conflicts early, while one given a vague request will quote the cheapest configuration that satisfies the wording and leave the rest to the integrator. Include questions that are easy to forget: whether the device supports multiple per-seat zones rather than a single detection area, whether firmware updates are remote and validated, whether events are buffered when a gateway loses connectivity, and whether mounting brackets suit the actual ceiling type, since a bracket mismatch across two hundred sensors is not a detail.
The checklist also protects the supplier relationship. A supplier who receives clear requirements can quote accurately and flag conflicts early, while a supplier who receives a vague request will quote the cheapest configuration that satisfies the wording and leave the rest to the integrator.
| Area | Question | Evidence to collect |
|---|---|---|
| Detection | Can the device resolve adjacent desks at the intended height | Beam pattern and resolution data |
| Stillness | Does it detect a seated, motionless person | Test result or field reference |
| Coverage | How many desks per device in this layout | Coverage drawing at final mount height |
| Timers | What are the confirmation and departure delays | Configuration range and defaults |
| Power | PoE, mains or battery, and expected life | Power profile calculation |
| Network | Which gateways and protocols are supported | Gateway datasheet and topology guide |
| Integration | Which API or event format is exposed | Interface documentation and sandbox |
| Privacy | What data is collected and stored | Data sheet and retention options |
| Compliance | Which certifications apply in this market | CE, FCC, RoHS or local equivalents |
| Support | Who answers a technical question during the pilot | Named contact and escalation path |
Requirements That Are Easy to Forget
Ask whether the device supports per-seat zones rather than only a single detection area, because some radar products expose one zone per sensor and cannot be configured into multiple desks. Ask whether the firmware can be updated remotely and how updates are validated. Ask what happens to stored data if the gateway loses connectivity, and whether events are buffered or lost.
Ask also about the mounting hardware. Ceiling-mounted sensors need brackets that suit the tile type, and a device that arrives without a suitable bracket becomes an installation problem on the day. For a fleet of two hundred sensors, a bracket mismatch is not a detail.
Selecting a Supplier for Desk-Level Sensing Projects
Selecting a supplier for desk-level sensing is an exercise in evaluating engineering support rather than brochure specifications. The device is a small part of the project; beam pattern data, interface documentation, the firmware update mechanism and the willingness to answer questions during a pilot decide whether the deployment succeeds, and a supplier that cannot describe detection behaviour in engineering terms will slow every integrator who touches the floor. Manufacturers that build radar modules and manufacturers that assemble workplace products are different businesses, so the useful question is whether the same team that designed the detection can support a mounting problem, a false-positive investigation and a firmware defect. Ask for beam patterns, recommended mounting heights and any desk-level field tests, plus the telemetry model, event schema, configuration parameters and error handling. Ask how long firmware is maintained, how security fixes ship and what notice precedes end of life.
Manufacturers that build radar modules and manufacturers that assemble workplace products are different businesses. The useful question is whether the same team that designed the detection can support the customer through a mounting problem, a false-positive investigation and a firmware defect. That support model matters more than any single parameter.
Documentation and Test Evidence
Ask for the beam pattern, the recommended mounting heights, the detection thresholds and any field test results at desk level. A datasheet that lists a detection range without saying at which height and angle the range was measured is not usable for planning. Ask how the supplier measured sensitivity and specificity, if they measured them at all.
Ask for interface documentation before ordering samples: the telemetry model, the event schema, the configuration parameters and the error handling. A supplier that treats integration as an implementation detail will produce a platform integration that behaves differently at every site.
Customisation and Lifecycle
Workplace projects frequently need a specific reporting interval, a branding requirement or a firmware behaviour that differs from the standard build. A supplier with its own engineering and production can accommodate that directly; one without engineering capacity will usually decline or delay past the project window.
Ask how long firmware will be maintained, how security fixes are distributed and what notice precedes end of life. A sensor fleet that is expected to run for eight years should not depend on a product that will be discontinued in three, and the end-of-life policy is as much a part of the specification as the detection range.
Combining Desk-Level Data With Room Sensing
Desk-level and room-level data answer different questions, and a workplace programme is usually stronger when both exist. A desk presence sensor for hot desking shows which seats are used, while meeting room sensors show whether rooms are used and by how many people; together they explain why a floor feels full while seat utilisation looks low, a pattern that appears when people spend most of the day in rooms and return to desks only to store belongings. The combination also changes planning decisions: a floor with low desk utilisation and high meeting room demand may need fewer desks and more small rooms, while the reverse suggests the opposite. Adding room sensing to a desk deployment usually costs little relative to the value of the combined picture. Use one data model for both, with presence intervals attached to a location identifier, and combine the feeds in the analytics layer rather than at the edge.
The combination also changes planning decisions. A floor with low desk utilisation and high meeting room demand may need fewer desks and more small rooms, while a floor with high desk utilisation and low room demand may need the opposite. Neither dataset alone supports that conclusion, and the cost of adding room sensors to a desk deployment is usually small relative to the value of the combined picture.
A Shared Data Model
Use one data model for both sources. Both produce presence intervals attached to a location identifier, whether that identifier is a desk or a room. Both should record the sensor, the timestamps and a confidence flag. When the models align, analytics can compare utilisation across space types without custom joins, and a change of vendor for one type does not break the other.
Resist the temptation to merge the raw streams at the edge. Keep desk and room data in their own feeds and combine them in the analytics layer, where the rules can change without reflashing devices.
Reporting for Different Audiences
Facilities wants to know which spaces to clean and maintain. Workplace wants to know which spaces to change. Finance wants to know which spaces to stop paying for. The same underlying data can serve all three, but the outputs should differ: exception lists for facilities, trend charts for workplace, and annualised space cost scenarios for finance.
A single dashboard that tries to serve all three usually serves none well. Build the views on top of the same data model rather than asking the sensor platform to produce every report.
Scaling a Desk-Level Sensing Programme
Scaling from one floor to a portfolio is a test of standardisation. A desk-level sensing programme that works on a pilot floor because the same two engineers designed, installed and tuned it will often fail on the next floor where a different contractor follows the drawing loosely. The remedy is a deployment template: a standard mounting detail, a standard configuration set, a standard commissioning record and a standard acceptance test, short enough to be followed and specific enough to be audited. The template should name the mounting height, the aiming method, the configuration values, the validation procedure and the person accountable for signing off each floor. Buy in waves rather than in one order, so a first wave of one or two floors exposes assumptions and a second confirms the template survives different contractors before the portfolio order is placed.
The template should be short enough to be followed and specific enough to be audited. It should name the mounting height, the aiming method, the configuration values, the validation procedure and the person accountable for signing off each floor. Sites that adopt a template can compare data across floors; sites that improvise discover that their analytics are comparing different things.
Procurement and Rollout Sequencing
Buy in waves rather than in a single order. A first wave of one or two floors exposes assumptions in the template, and a second wave of a few more confirms that the template survives contact with different contractors. Only then should the portfolio order be placed, because by that point the specification, the integration and the operational workflow have all been tested.
Sequence also matters for network changes. Gateways and switches are easier to install during planned works than as an emergency addition, and the facilities team will thank a programme that arrives with a schedule rather than a request.
Owning the Fleet After Handover
Assign ownership before the last floor is commissioned. Someone must own the mapping table, the firmware baseline, the battery schedule and the audit cadence. In practice this is often a workplace technology lead working with facilities, and the most common failure is that nobody is named until the first data question arrives.
Write the ownership into the project close-out document along with the credentials, the configuration record and the escalation path. A programme that ends without that document is not finished; it is merely installed.
Hybrid Work Policy and Desk-Level Measurement
Desk-level measurement turns hybrid work policy from an assumption into a measurement. Most organisations set attendance expectations without knowing which days people actually come in, which teams cluster together, or whether a policy that requires three days a week produces three days of seat demand or five days of booking demand with two days of use. Seat-level data answers those questions directly, and it does so without turning the policy debate into an argument about badge logs that count building entries rather than working seats. It also shows whether attendance is stable or whether peaks are concentrated in a few days, which decides whether a floor needs more seats or better scheduling. The measurement is useful precisely because it is boring: it records what happened seat by seat, week by week, and lets the policy conversation rest on evidence that both facilities and the business can inspect.
Measurement also changes the conversation about fairness. When a team hears that its floor is forty percent utilised, the number is easy to dispute; when it hears that its own neighbourhood averaged two occupied desks out of six across eight weeks, the discussion moves to layout and scheduling. That shift from assertion to evidence is the practical contribution of desk-level sensing to hybrid policy.
What to Measure and What to Avoid
Measure seat occupancy by day of week, by neighbourhood and by booking status. Avoid measuring individuals. Aggregating to the team or floor level gives policy-makers what they need while keeping the data outside the scope of performance management. If a report can be read as a ranking of employees, the aggregation is too fine.
Avoid also the temptation to publish daily dashboards to the whole organisation. Weekly or monthly summaries reduce noise and stop people from optimising their behaviour against a live number, which produces data that no longer reflects normal use.
Connecting Policy to Layout
The most useful output links policy to furniture. If Tuesday is the peak day and the floor runs out of seats while Thursday sits half empty, the policy may need scheduling guidance, the layout may need more collaborative seating, or the floor may need a different mix of desks and rooms. Sensor data will not make that decision, but it supplies the evidence that makes the decision reviewable.
Teams that run this cycle quarterly tend to keep their data trustworthy, because the numbers are used and therefore checked. Data that nobody consumes drifts without anyone noticing.
Desk-Level Sensing Deployment Timeline
A desk-level sensing deployment follows a predictable sequence, and most schedule overruns come from compressing the early phases rather than from slow installation. The phases are: requirements and layout survey, coverage design, pilot, integration, rollout and handover. Each phase produces an artefact that the next phase depends on, so skipping one moves the cost forward rather than removing it. The layout survey produces the floor plan and mounting constraints, the coverage design produces the sensor-to-desk mapping, the pilot produces measured sensitivity and specificity, the integration produces a working reconciliation rule, and the rollout produces an as-built record for the whole estate. Teams that treat those artefacts as deliverables, rather than as paperwork, find that the schedule defends itself: each gate has evidence attached, and a delay is visible before it becomes a surprise at handover.
A realistic programme treats the pilot as a gate rather than a formality. If the pilot does not meet its acceptance criteria, the programme should pause and fix the design, because scaling a flawed mounting plan multiplies the defect across every floor.
Phase Durations and Dependencies
The layout survey and coverage design typically take one to three weeks depending on floor complexity. The pilot runs four to eight weeks to cover quiet and busy periods. Integration work overlaps the pilot and often determines the pilot's usefulness, because without booking reconciliation the data cannot be validated against real demand. Rollout proceeds in waves, with each wave including commissioning and acceptance testing.
Dependencies matter more than durations. The coverage design needs the final floor plan, the integration needs the booking platform's API access, and the rollout needs ceiling access scheduled with facilities. Projects that list the dependencies explicitly finish closer to plan than projects that list only dates. A typical mid-size floor takes two to four weeks from survey to a working pilot, and the pilot needs at least four weeks of data before the acceptance criteria can be evaluated with confidence. Integration often runs in parallel and should start as soon as the booking platform's API access is available, because it is the phase most likely to reveal a gap between what the sensor can publish and what the platform can consume.
Handover Artefacts
Handover should include the as-built mapping table, the per-sensor configuration record, the firmware baseline, the battery schedule, the audit cadence and the escalation path. Without these, the fleet becomes undocumented infrastructure, and the next change, whether a furniture move or a firmware update, happens without a baseline to compare against. Store the record where the facilities team already keeps building documentation rather than in a project folder that closes when the programme ends, so a future contractor can understand the mounting logic without calling anyone.
Desk Presence Sensor for Hot Desking FAQ
These are the questions that come up most often when a workplace team evaluates a desk presence sensor for hot desking, and each answer is written to stand alone because the people asking rarely sit in the same meeting. A facilities manager wants to know what changes operationally, a workplace strategist wants to know whether the numbers can support a space decision, an IT architect wants to know how the data reaches the booking platform, and a privacy officer wants to know what is stored and for how long. The answers below cover what the sensor measures, why it cannot identify individuals, how accuracy should be described, how many desks one device can cover, whether it integrates with existing booking systems, what the legal position looks like, how long batteries last and which cost drivers dominate a deployment.
What does a desk presence sensor for hot desking actually measure?
It measures whether a specific desk is occupied at a given moment, how long that state persists and, in some configurations, how many people are present in a small zone. The measurement comes from motion, thermal or radar sensing depending on the technology. It does not identify the person, does not record images and does not know whether the occupant is the person who booked the desk.
Can it tell who is sitting at a desk?
No. Radar and infrared sensors detect presence, not identity. Any system that claims to attribute a seat to a person must combine the sensor with another signal such as a badge event or a booking confirmation, and it should say so explicitly because the privacy implications are different. Most hot-desking programmes do not need attribution to answer their planning questions.
How accurate is a desk-level sensor in practice?
Accuracy should be described as a pair of numbers: the share of genuinely occupied time reported as occupied, and the share of genuinely empty time reported as empty. A well-mounted 60 GHz radar in a suitable layout can reach high values on both, but performance depends on mounting height, aiming, obstructions and timers. Measure both during a pilot rather than relying on a single percentage from a datasheet.
How many desks can one sensor cover?
In practice, one to four desks per device for per-seat data with a narrow-beam ceiling sensor, or six to eight for zone-level counting with a wider beam. The limit is not range but resolution: the sensor must be able to separate adjacent people and ignore passers-by. Draw the coverage on the actual floor plan before ordering.
Will it work with our booking system?
It will if the booking platform exposes an API or accepts desk state updates, and if the sensor platform can publish events or be polled. The integration is usually straightforward; what takes time is agreeing what happens when the sensor and the booking disagree. Define that rule before the integration is built.
Is desk-level sensing allowed in the workplace?
It is allowed in many jurisdictions when it is necessary, proportionate and transparent, and when the data does not become a tool for individual monitoring. That usually means aggregating before analysis, avoiding attribution, excluding sensitive spaces and documenting the purpose. In European countries with works councils, expect consultation and prepare the documentation before installation.
How long do batteries last?
Life depends on the radio link and the reporting profile more than on the sensing itself. A sensor that reports only on state changes will outlast one that reports on a fixed interval. Ask for the calculation at your expected event count, then add a maintenance schedule for replacement rather than waiting for devices to fail.
How often should desk-level accuracy be re-audited?
Re-audit after any firmware update, furniture change or ceiling works, and run a light monthly spot check on a small sample of desks in between. The monthly check does not need to be statistically rigorous; its purpose is to catch drift before it reaches a planning decision. Record the results next to the sensor identifiers so that a later investigation has a baseline to compare against.
Can we start with one floor and add more later?
Yes, and that is usually the right sequence, provided the first floor uses the same mounting detail, configuration values and mapping format that later floors will use. A pilot that invents its own local conventions becomes a one-off, and the second floor starts the design work again. Treat the first floor as a template that happens to be installed in a real building, and review that template with the contractor before the second wave begins, because the people who install it will notice practical details that the design team did not.
What drives the cost of a deployment?
Four things: device count per floor, ceiling access and installation labour, gateway and network work, and integration effort. Ceiling access is the most frequently underestimated, especially in occupied buildings. The business case usually rests on avoiding seats, so the cost should be compared with the annual all-in cost per seat rather than with the price of a sensor.
Not sure which sensor fits your project?
Talk to our mmWave application engineers for a free consultation.
Find the right presence sensor for your hotel project
Compare the 3 protocols, check hotel-specific case studies, and download the installation guide
Related products
3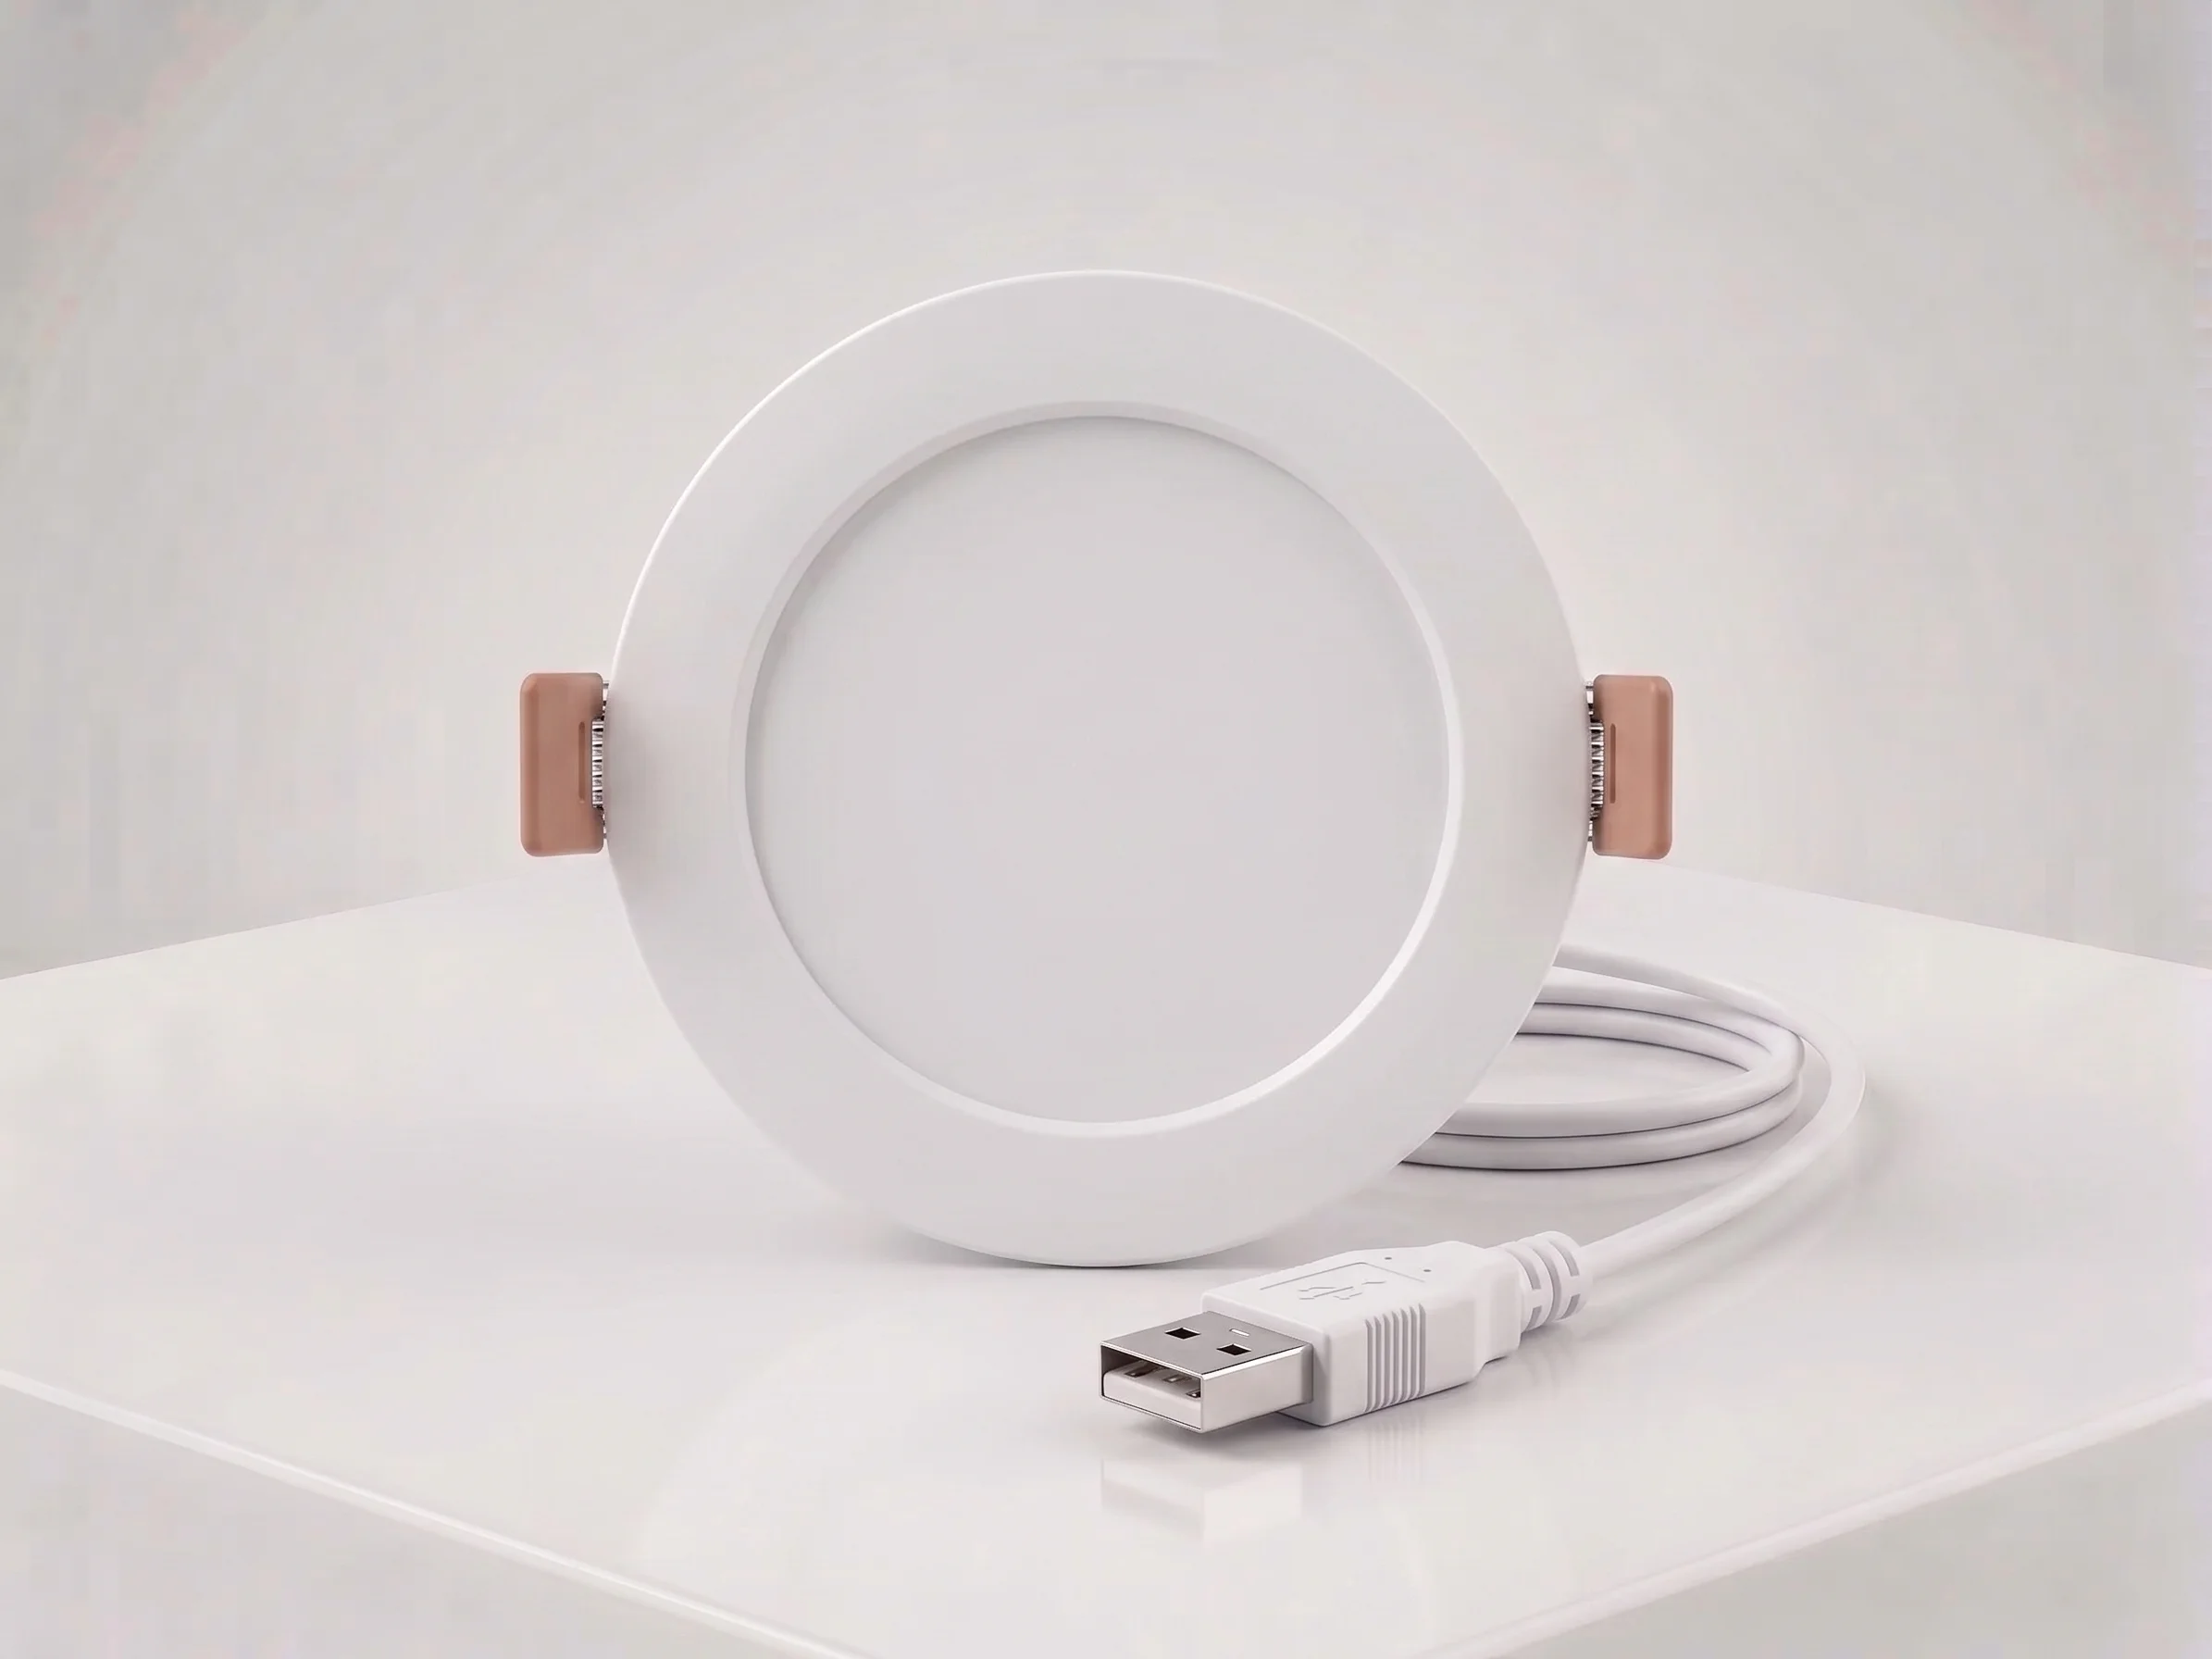
Ceiling Mount mmWave Human Presence Sensor — 60GHz
60GHz (57–64GHz) mmWave ceiling presence sensor with 7GHz bandwidth, 2.1cm range resolution, and breathing-level micro-motion detection. 120° field, DC5V, Zigbee 3.0. For hotel room occupancy and commercial automation where fine stationary-occupant accuracy matters.
This page already points to it as the next recommended reference.
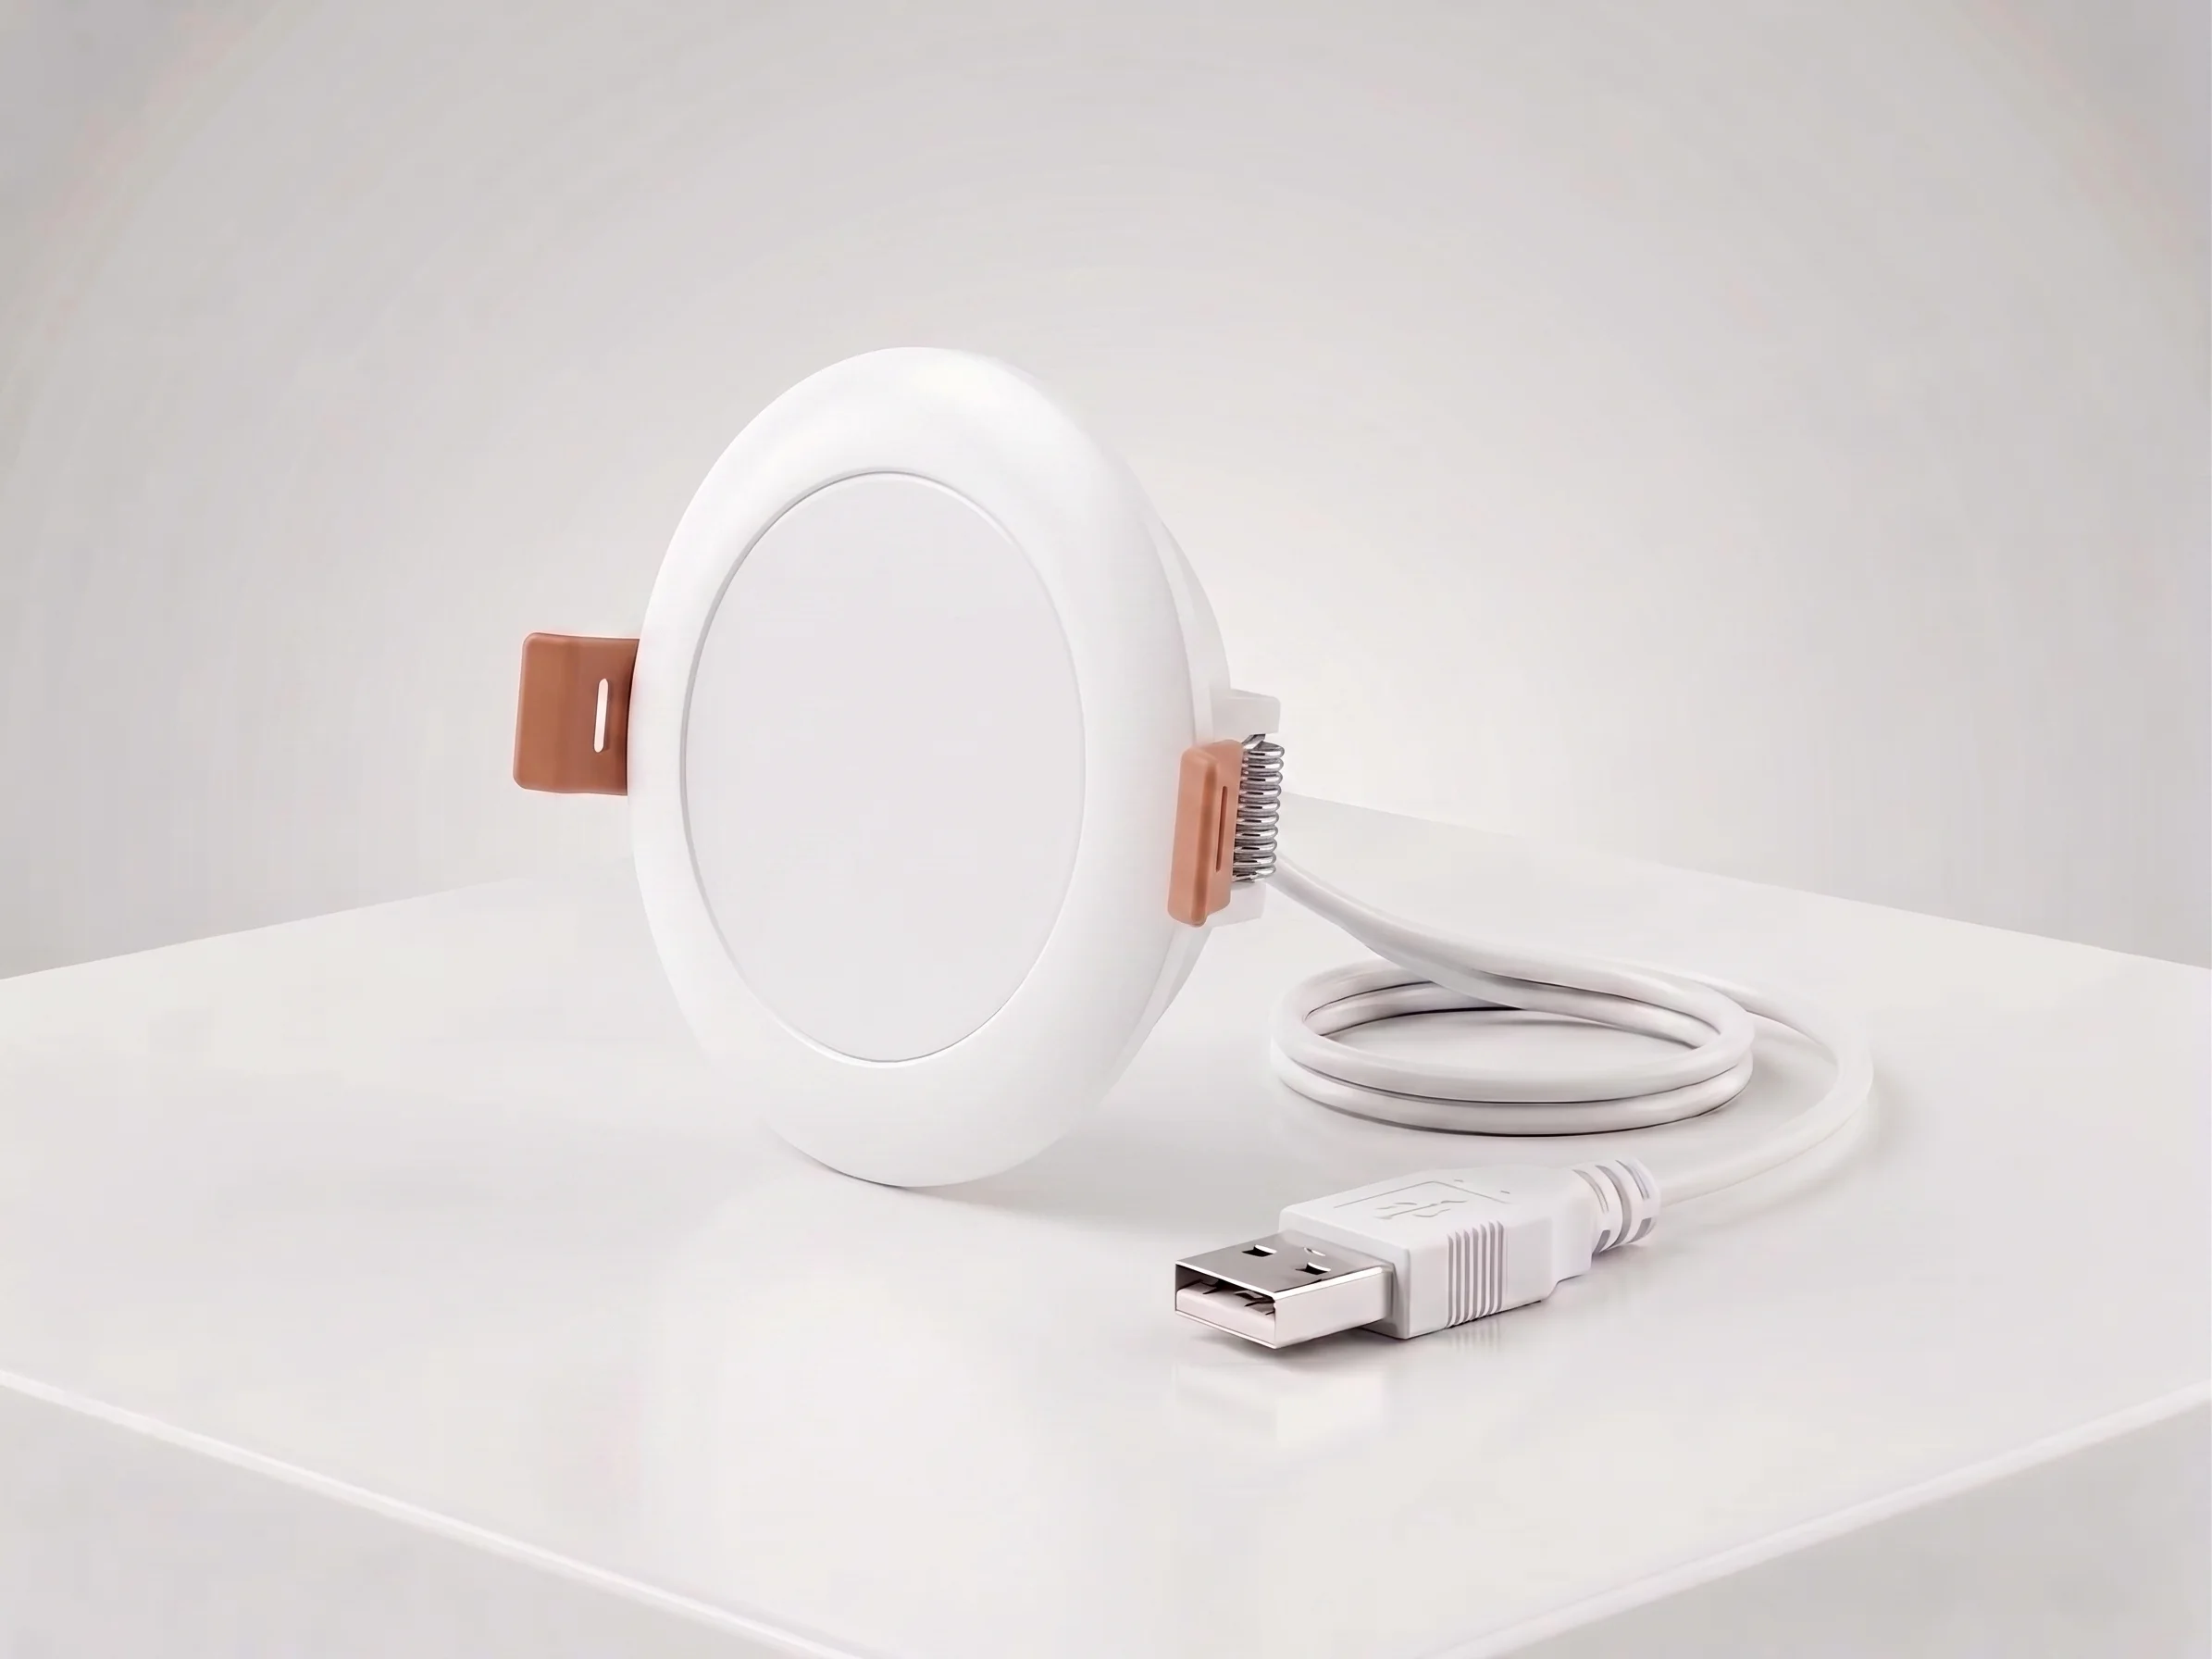
Ceiling Mount mmWave Human Presence Sensor — Zigbee
24GHz wideband mmWave ceiling presence sensor with 10m motion detection, 2.5m micro-motion, and breathing detection. 120° field, DC5V, Zigbee 3.0. For hotel room occupancy and commercial automation.
This page already points to it as the next recommended reference.
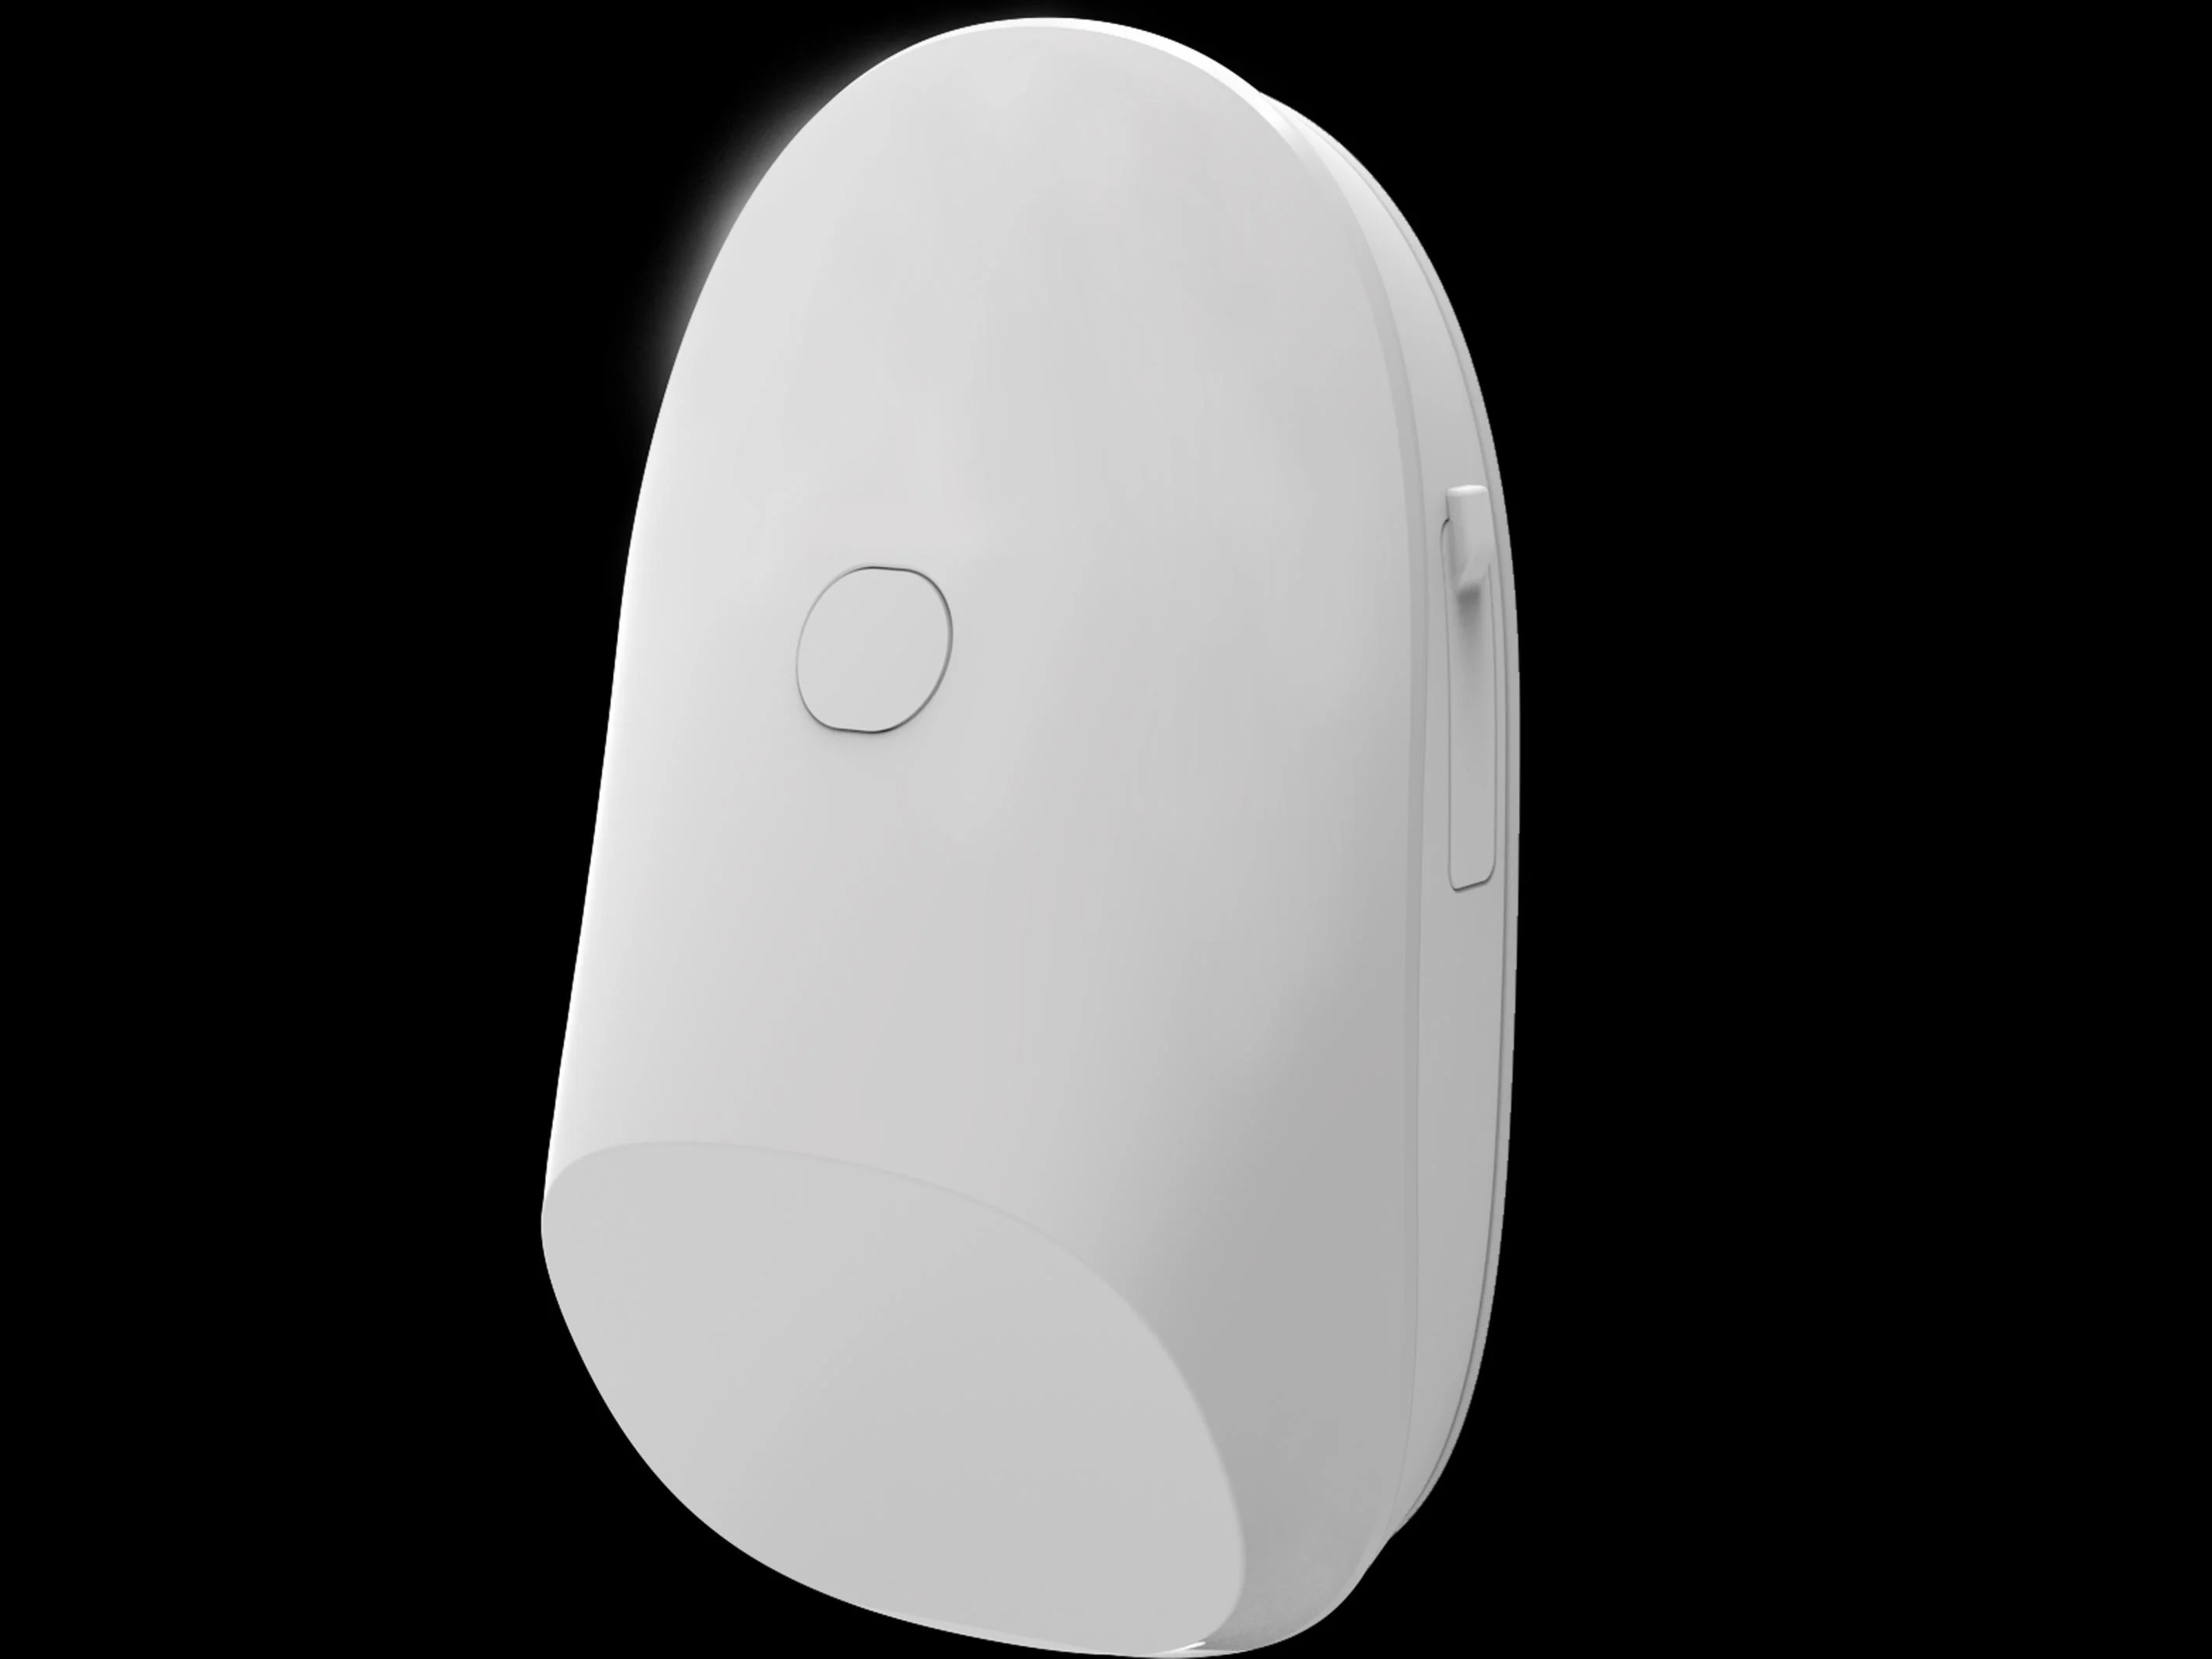
People Counting Radar — Ceiling and Wall Mount 60GHz mmWave Sensors
Two 60GHz mmWave people counters: a recessed ceiling unit on a two-wire AC feed for wide-area counting, and a wall-mount unit with trajectory and entry/exit statistics over WiFi and MQTT. No cameras, no cloud dependency for the count itself.
This page already points to it as the next recommended reference.
Useful resources
3
PS-60C-01 Datasheet — People Counting Radar — Ceiling Mount, 60 GHz
PS-60C-01 datasheet: 60 GHz ceiling people counting radar on AC 110–220 V with configurable irregular detection boundary.
It supports the same product context: People Counting Radar — Ceiling and Wall Mount 60GHz mmWave Sensors.
PS-60W-01 Datasheet — People Counting Radar — Wall Mount, WiFi
PS-60W-01 datasheet: 60 GHz wall-mount people counting radar with trajectories, entry/exit statistics and WiFi to an MQTT server.
It supports the same product context: People Counting Radar — Ceiling and Wall Mount 60GHz mmWave Sensors.
PS-CM-60G Datasheet — 60 GHz Ceiling mmWave Presence Sensor
PS-CM-60G datasheet: 60 GHz ceiling mmWave presence sensor with 7 GHz bandwidth, 2.1 cm range resolution, 2.5 m micro-motion, 120° field, Zigbee 3.0.
It supports the same product context: Ceiling Mount mmWave Human Presence Sensor — 60GHz.
Related solutions
3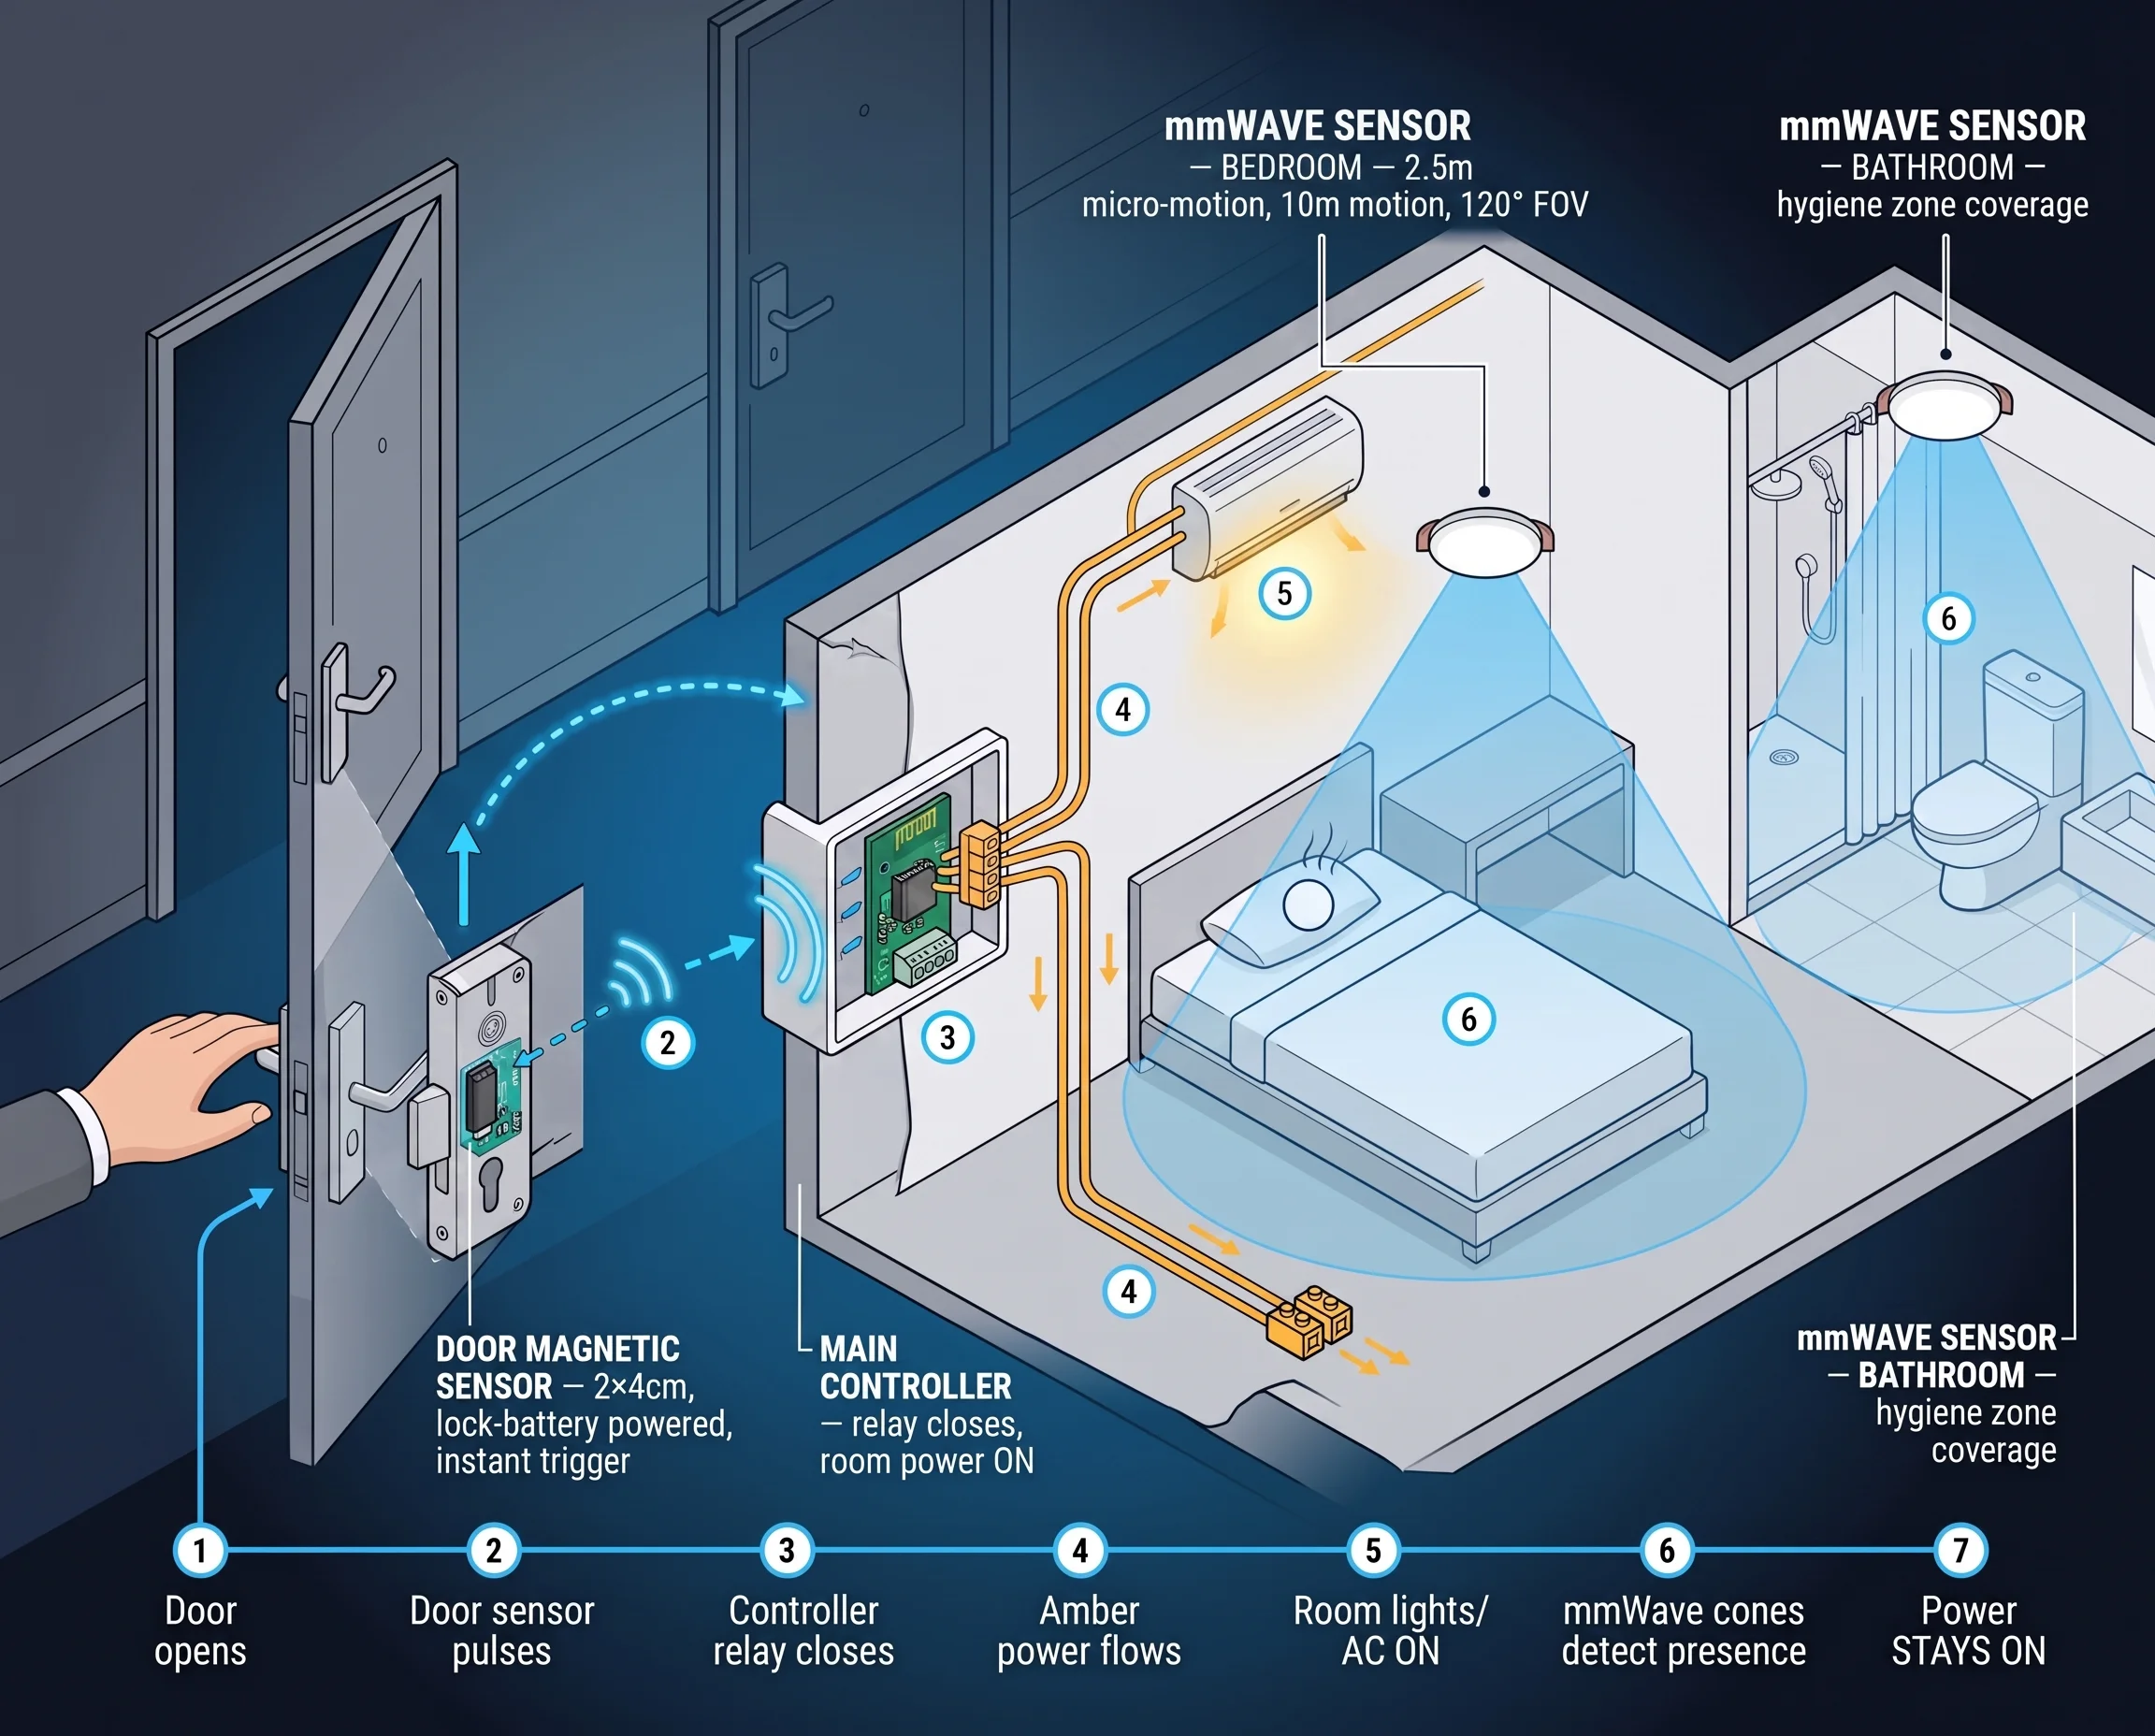
Hotel Room Occupancy & Motion Sensor Solution
mmWave radar presence sensors for hotel room occupancy, housekeeping scheduling, and HVAC energy saving. Detect true occupancy — even when the guest is asleep — with our ceiling-mount hotel room motion sensor.
It supports the same product context: Ceiling Mount mmWave Human Presence Sensor — Zigbee.
Hotel Room Energy Management System
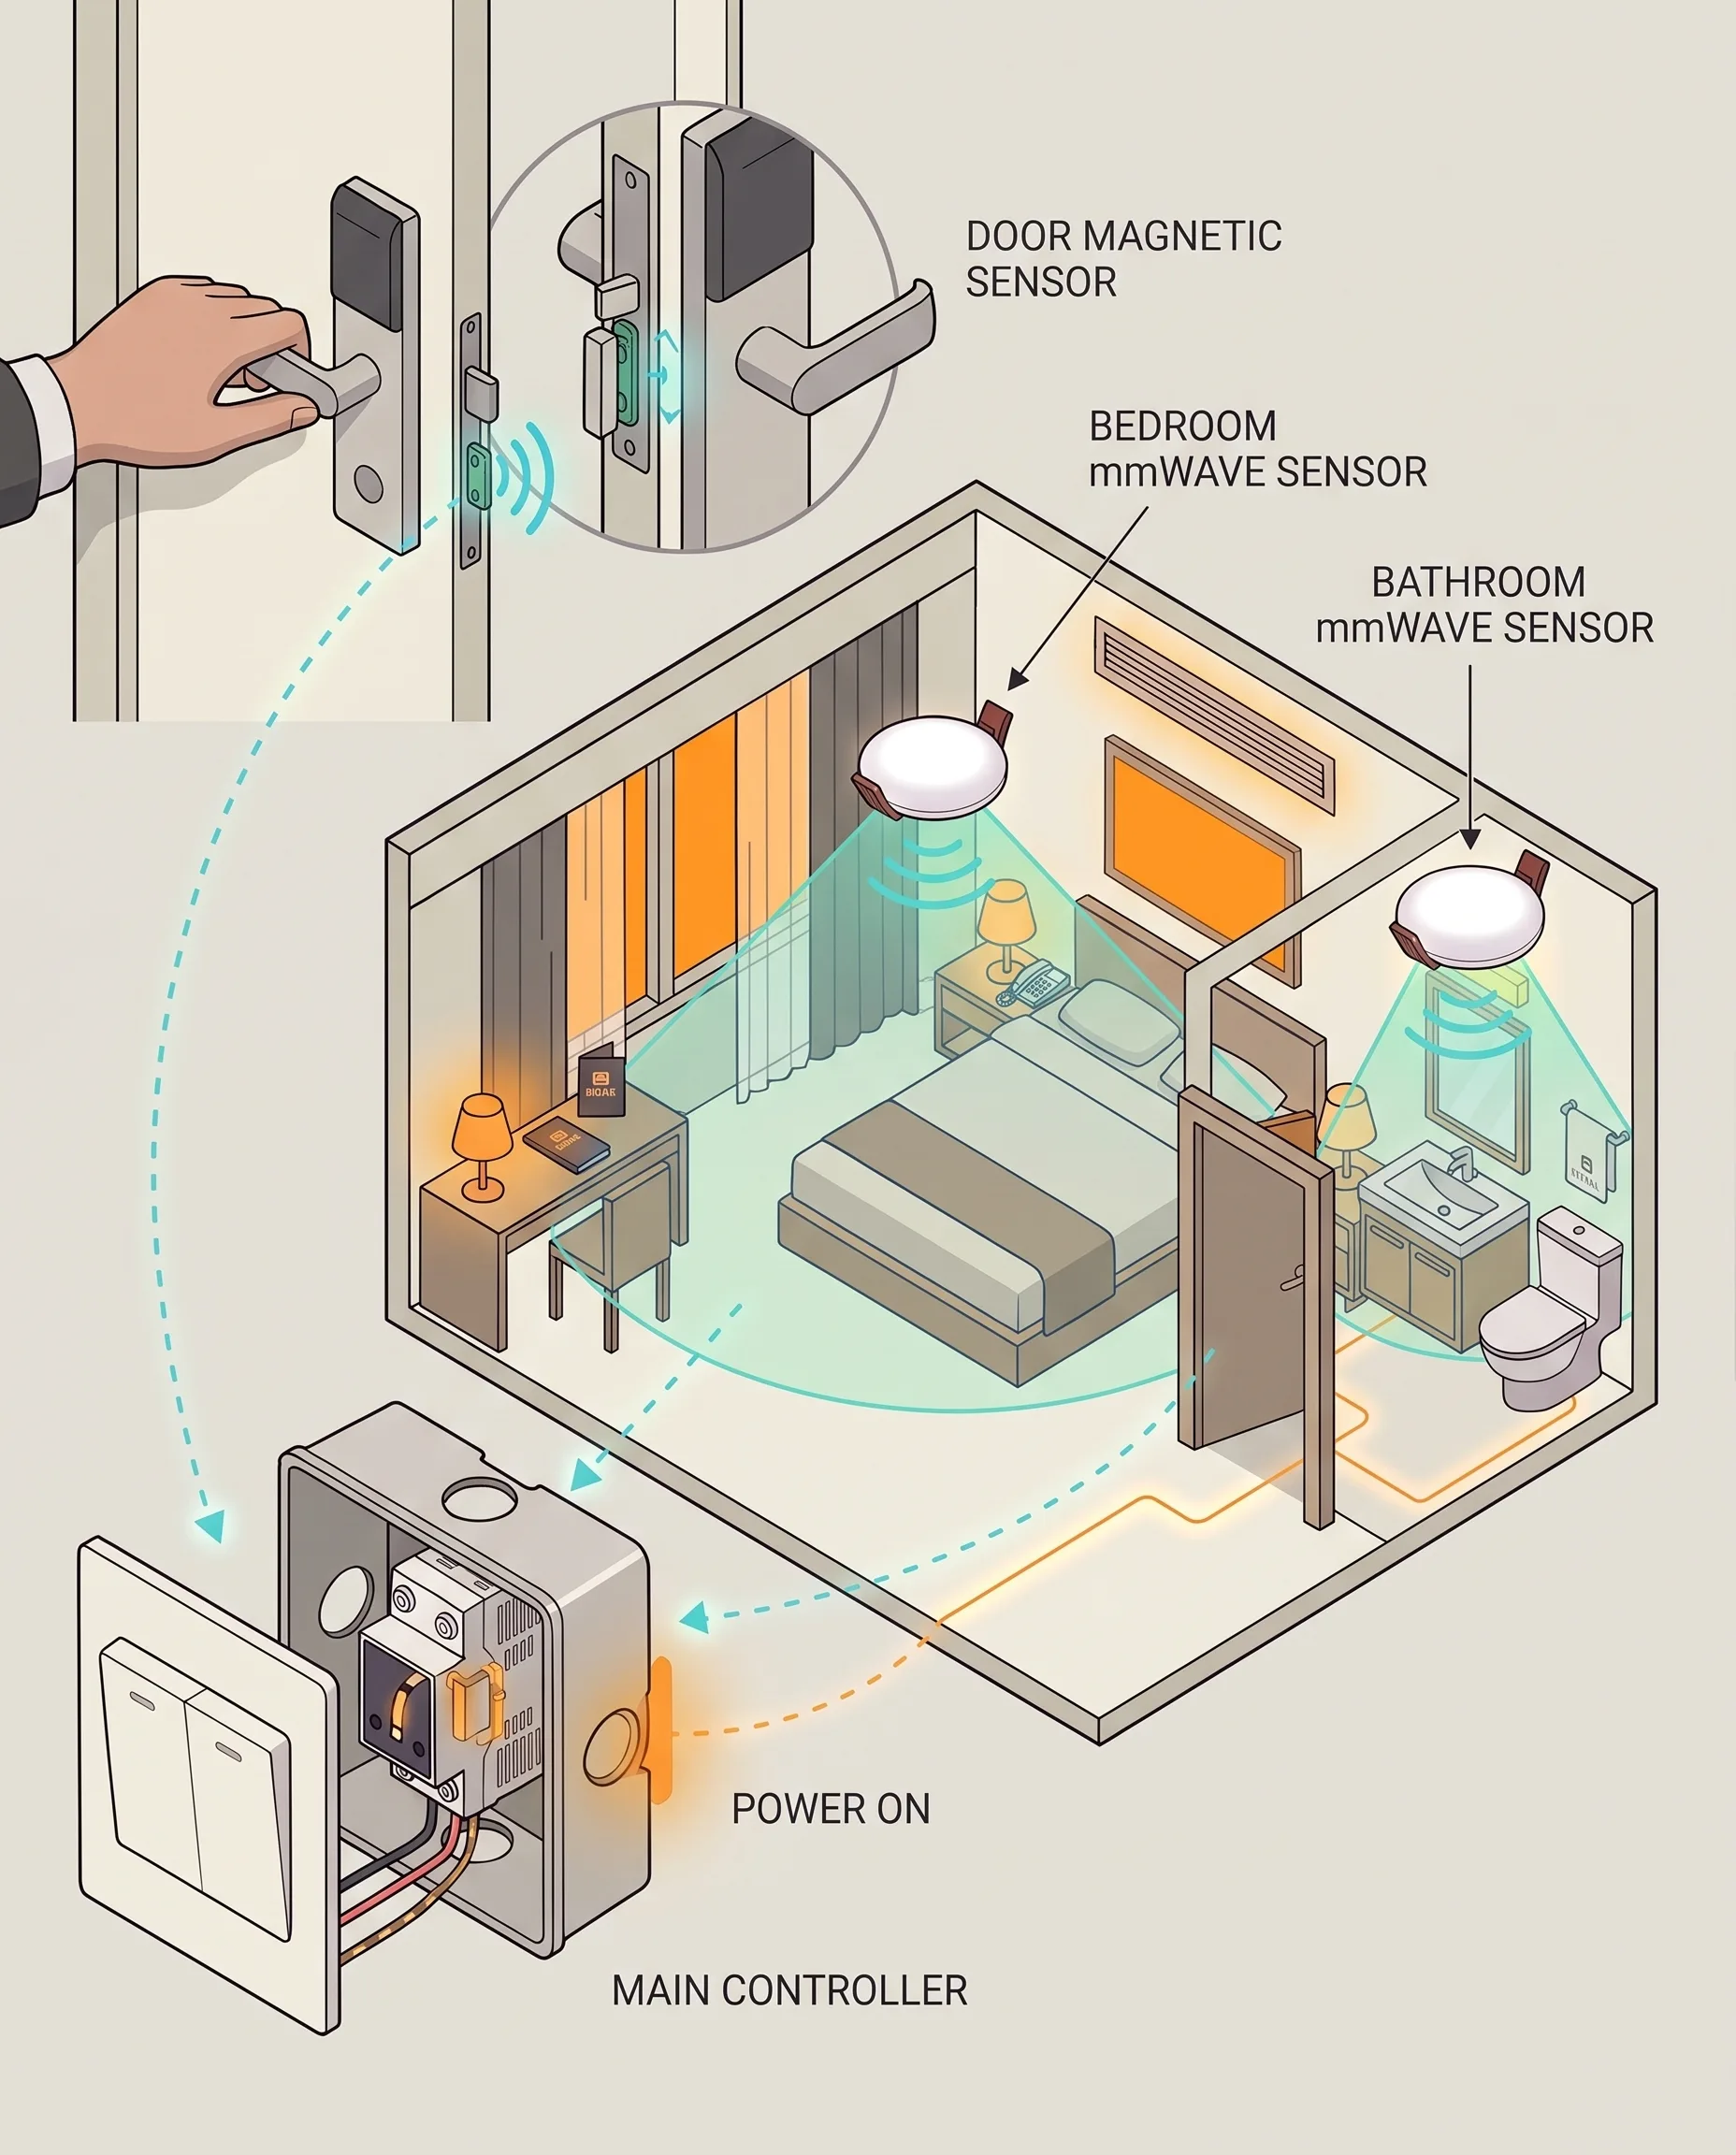
Local guest room power control: two ceiling mmWave presence sensors, a door-lock magnetic contact and a controller inside the existing switch box, all in-room.
It supports the same product context: Ceiling Mount mmWave Human Presence Sensor — Zigbee.
Meeting Room Occupancy Sensor
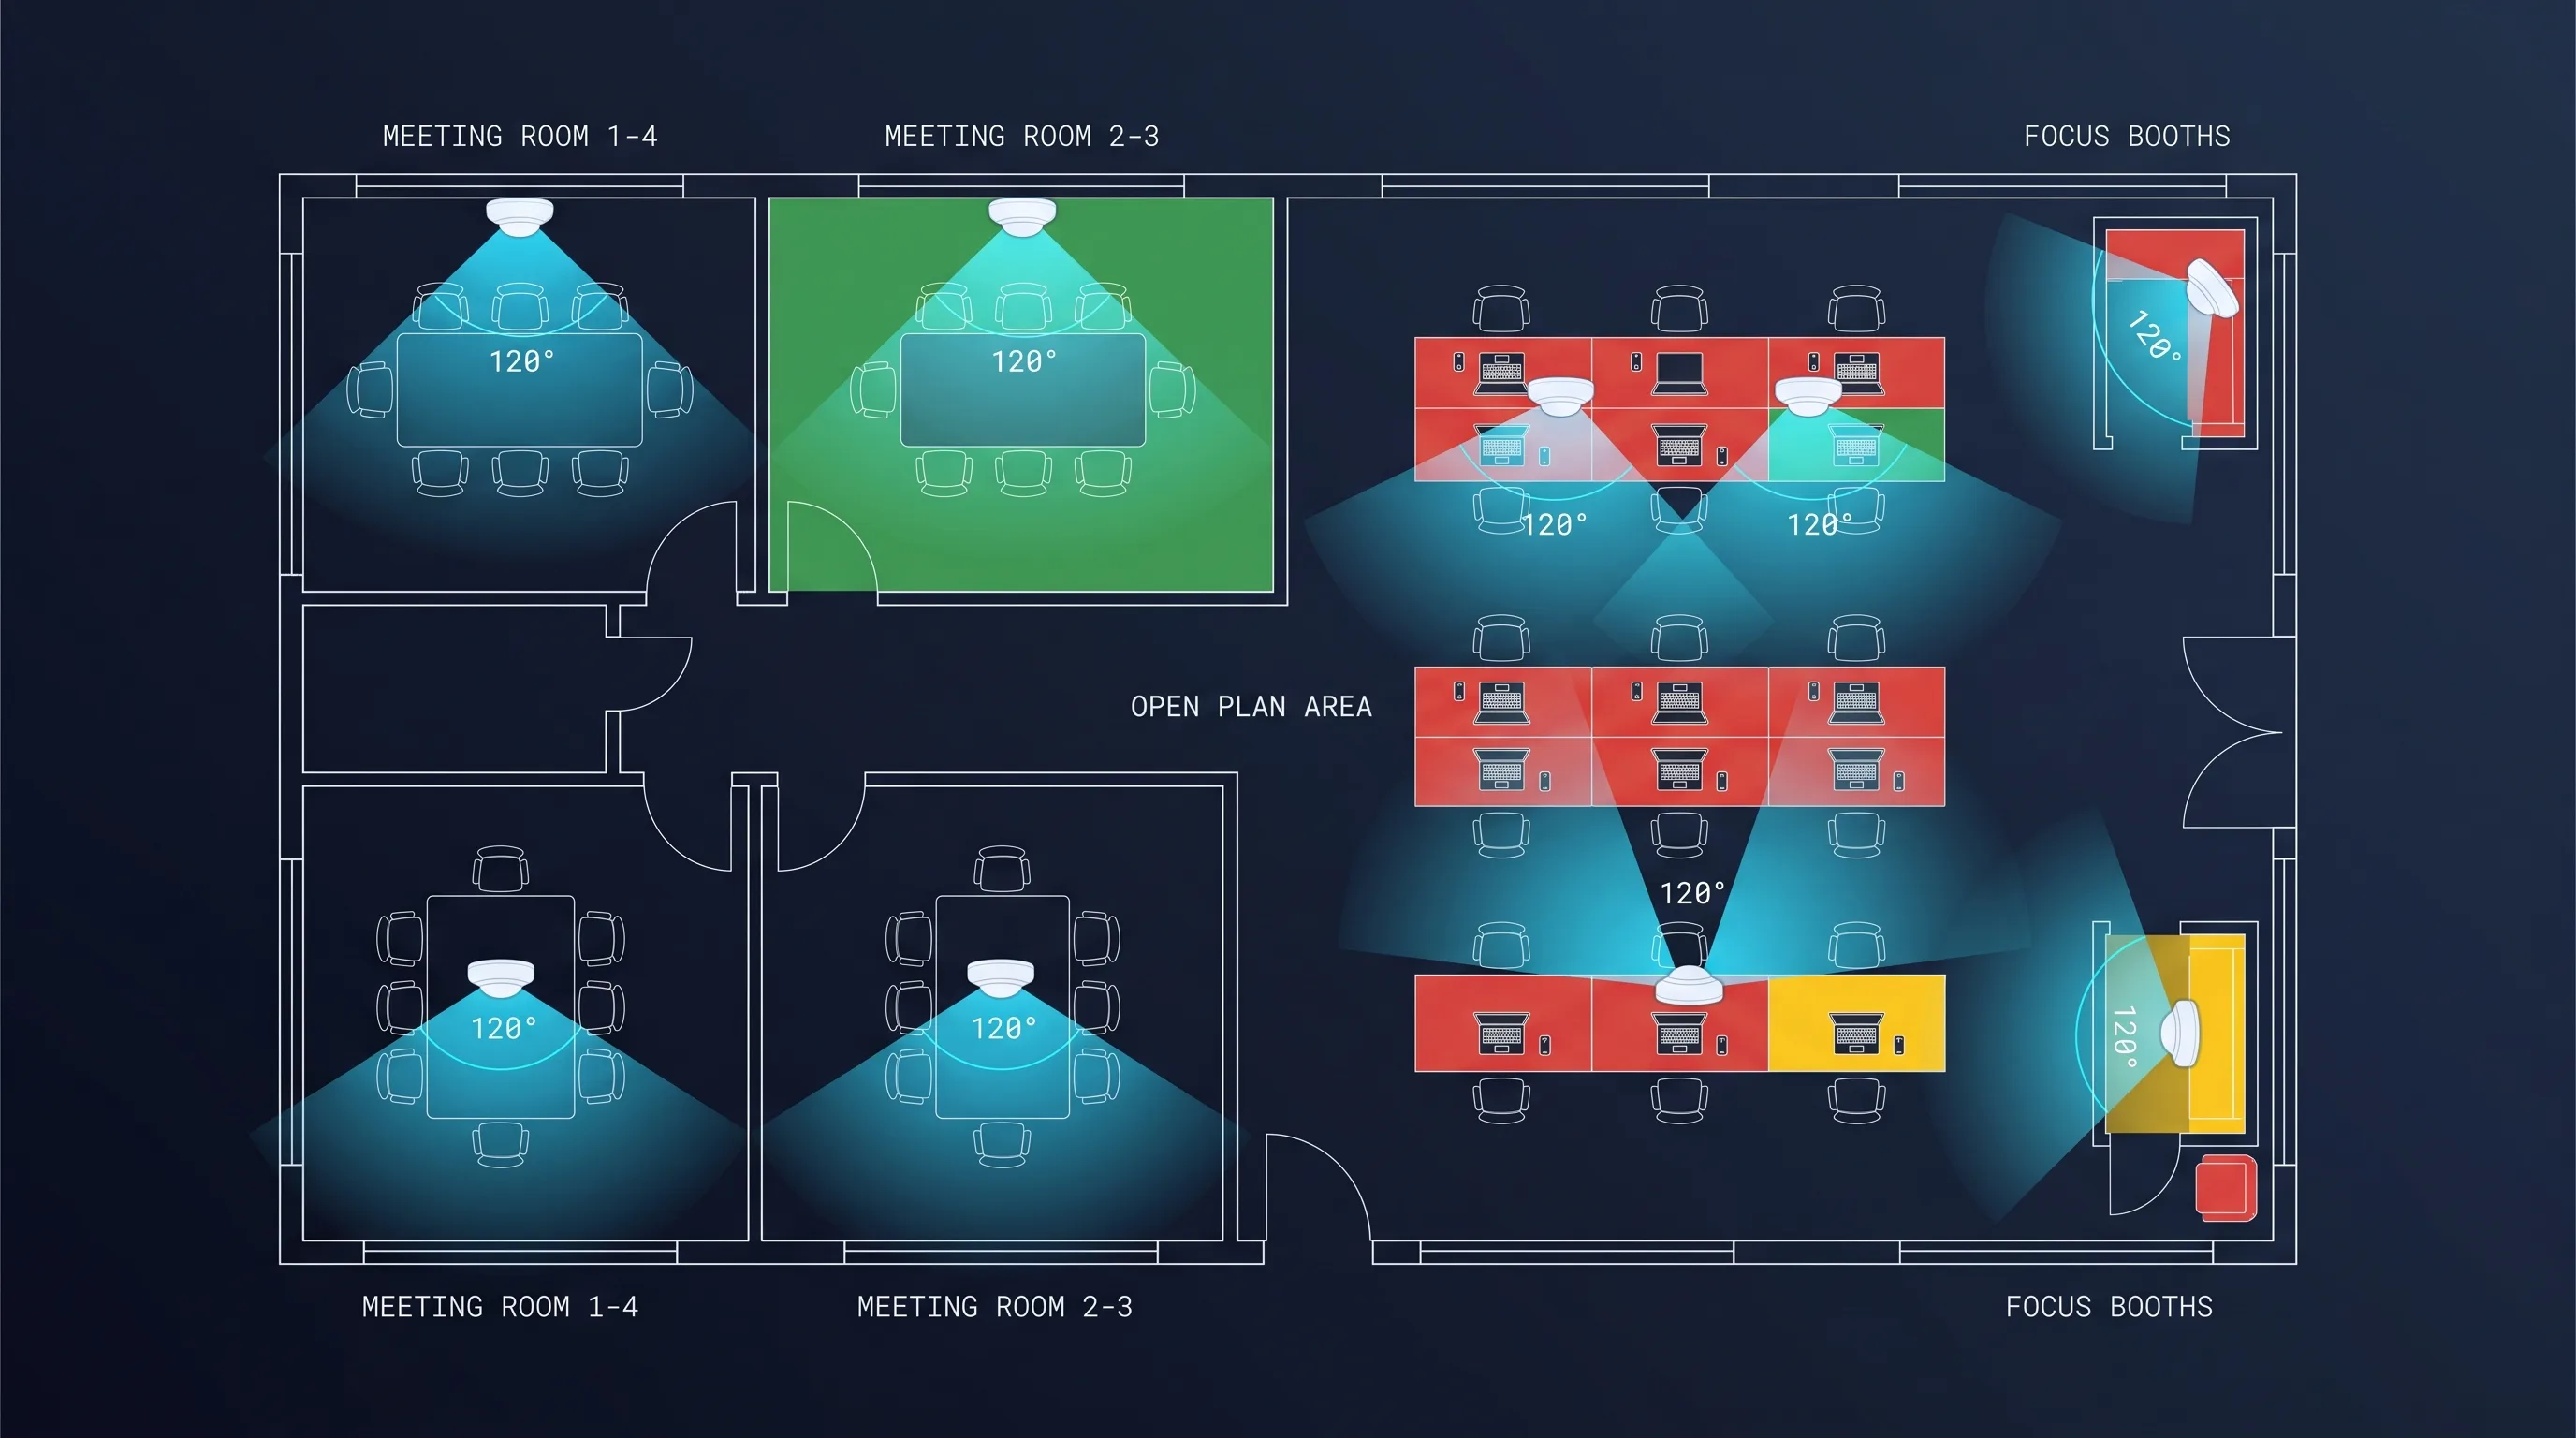
mmWave presence sensors for meeting rooms and offices: lighting and HVAC follow seated occupants that PIR misses, and rooms are released only when truly empty.
It supports the same product context: Ceiling Mount mmWave Human Presence Sensor — Zigbee.
Related blog posts
3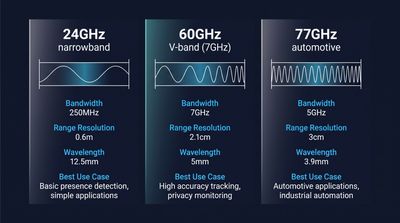
60GHz vs 24GHz vs 77GHz mmWave Sensors: Choosing the Right Frequency for Commercial Presence Detection
Compare 60GHz, 24GHz, and 77GHz mmWave sensors for commercial presence detection. Technical specs, detection range, privacy, and OEM sourcing guidance.
It supports the same product context: Ceiling Mount mmWave Human Presence Sensor — 60GHz, Ceiling Mount mmWave Human Presence Sensor — Zigbee.
What Is an Electronic Presence Sensor? Technology, Accuracy, and How It Differs From a Motion Sensor
Learn what an electronic presence sensor is, how it detects stationary humans, and how it differs from a PIR motion sensor. Covers mmWave, accuracy, and use cases.
It supports the same product context: Ceiling Mount mmWave Human Presence Sensor — Zigbee.
How to Integrate mmWave Presence Sensors With Home Assistant (Local Control Guide)
Step-by-step local control setup guide for mmWave devices, covering MQTT/Matter config, automation scripts, calibration and OEM ceiling presence sensor integration tips.
It supports the same product context: Ceiling Mount mmWave Human Presence Sensor — Zigbee.
Specify your hotel project with our engineers
Send your room count, ceiling type, and protocol preference. We will return a sample plan and quote within 24 business hours.
- Move from general guidance into a product or application discussion.
- Use RFQ when pricing, drawings, MOQ, or launch timing needs structure.
- Keep a direct contact path visible for fast clarifications and handoff.